Features
Real-Time Reporting & Analytics
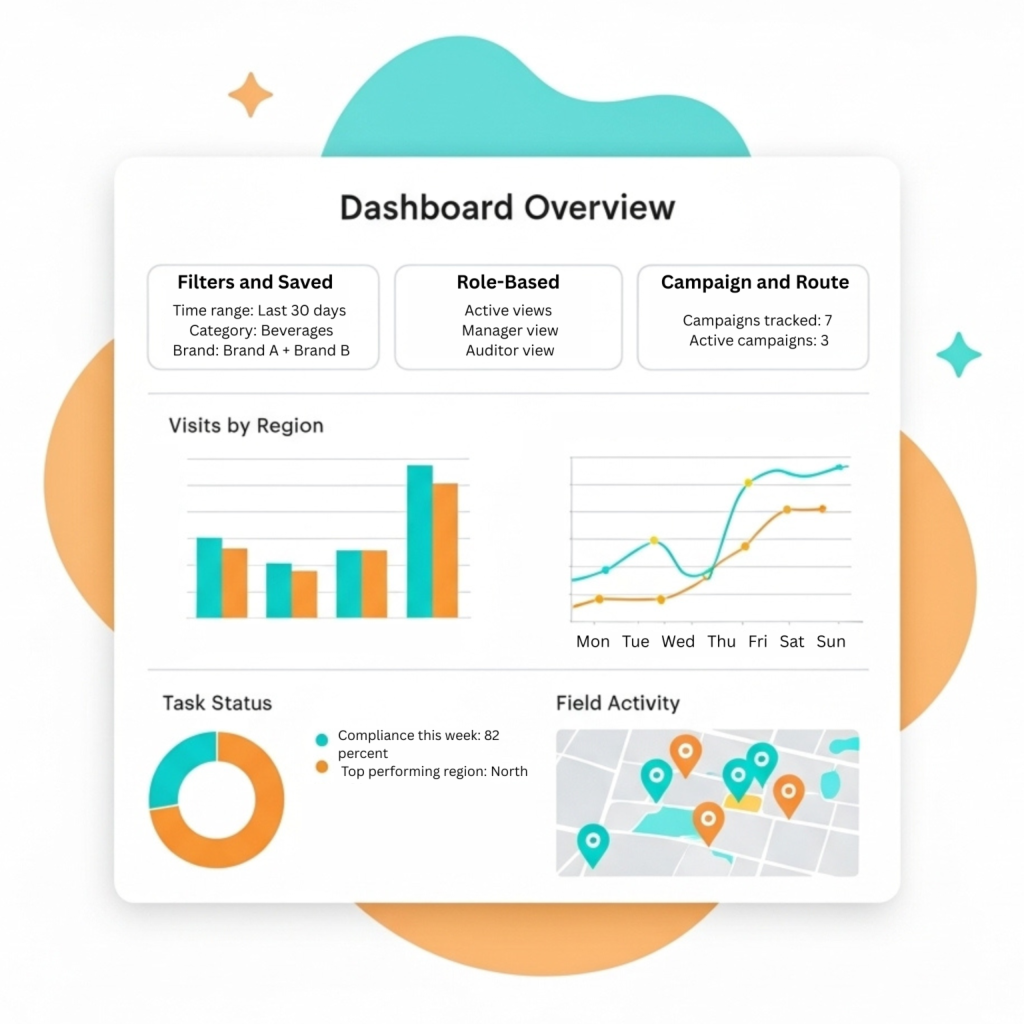
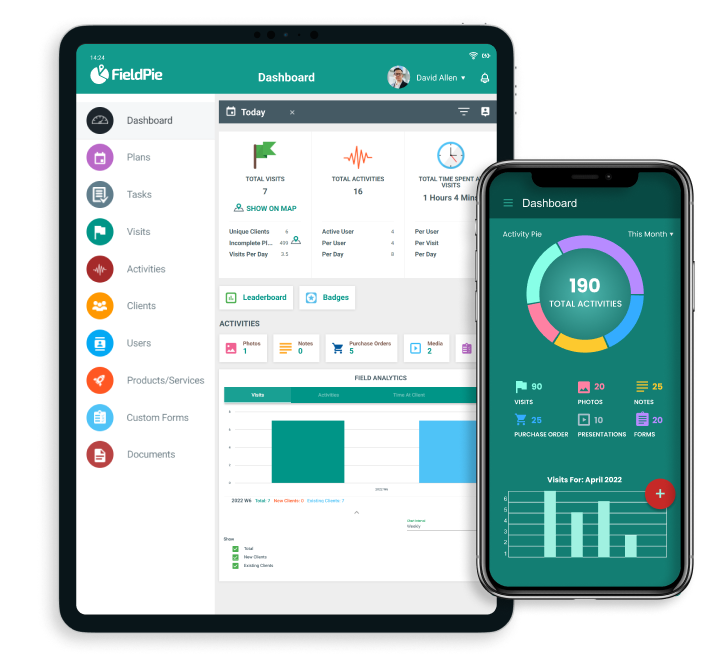
Gain instant visibility with real-time reporting and live dashboards tailored to your business. Track key metrics, monitor activities, and make data-driven decisions on the spot.
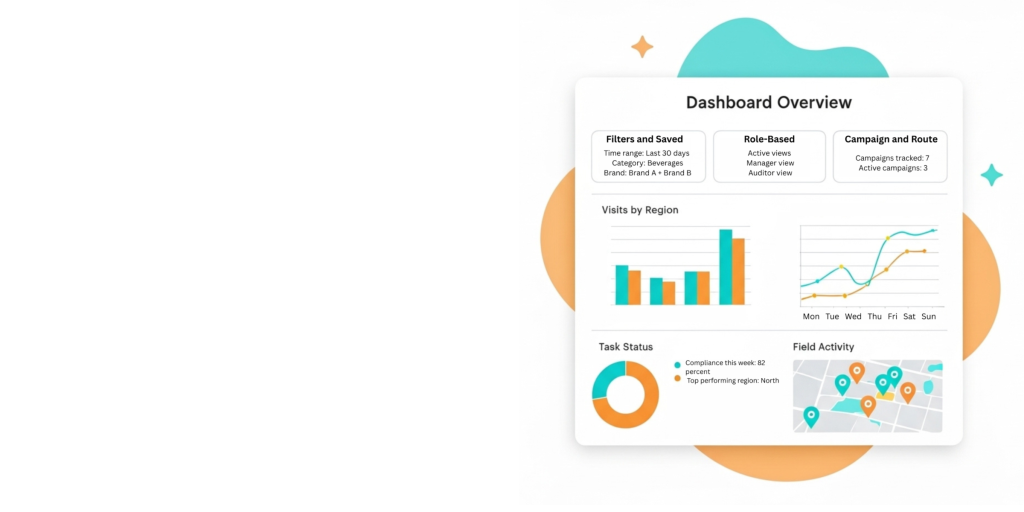

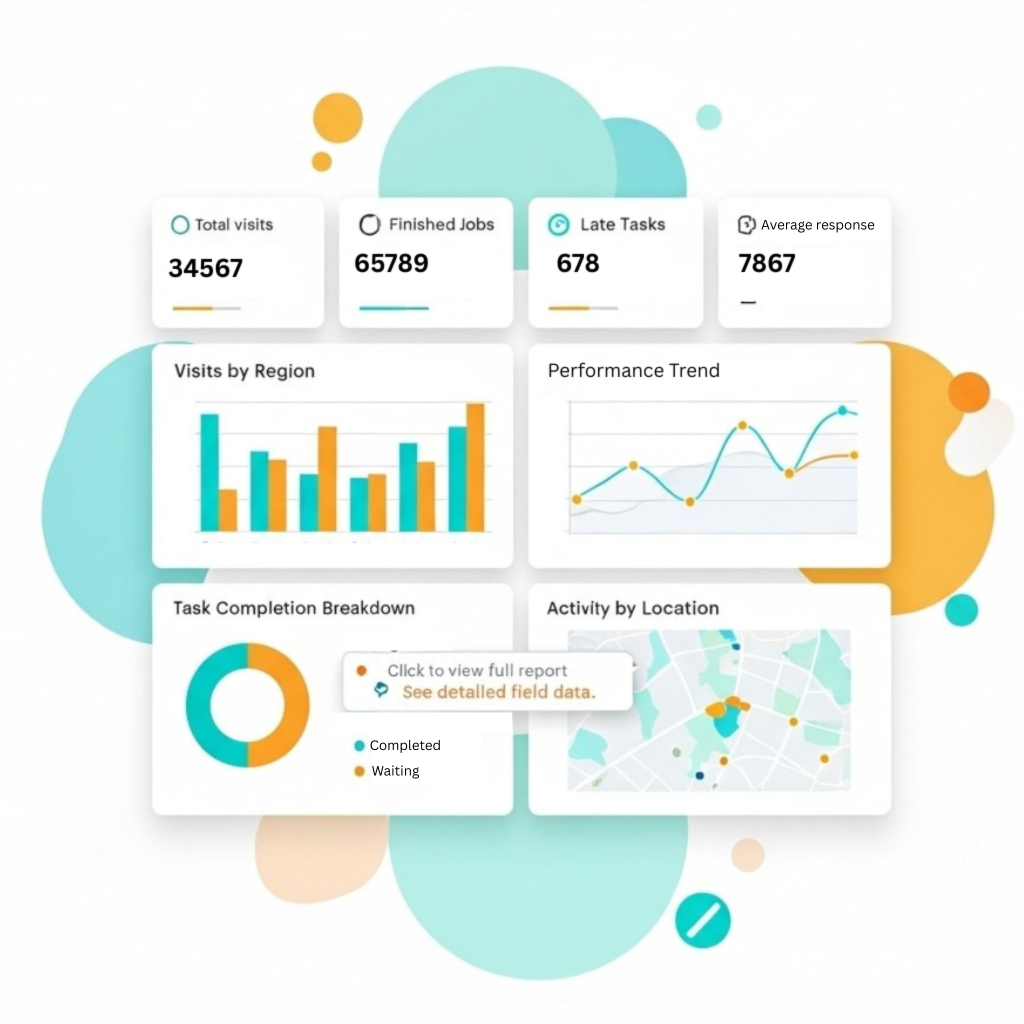
Dashboards & KPIs
- See all key metrics in one real-time view.
- Compare performance across teams, regions, clients, or locations.
- Drill down from high-level KPIs to detailed field data.
- Spot issues early and identify top or low performers.
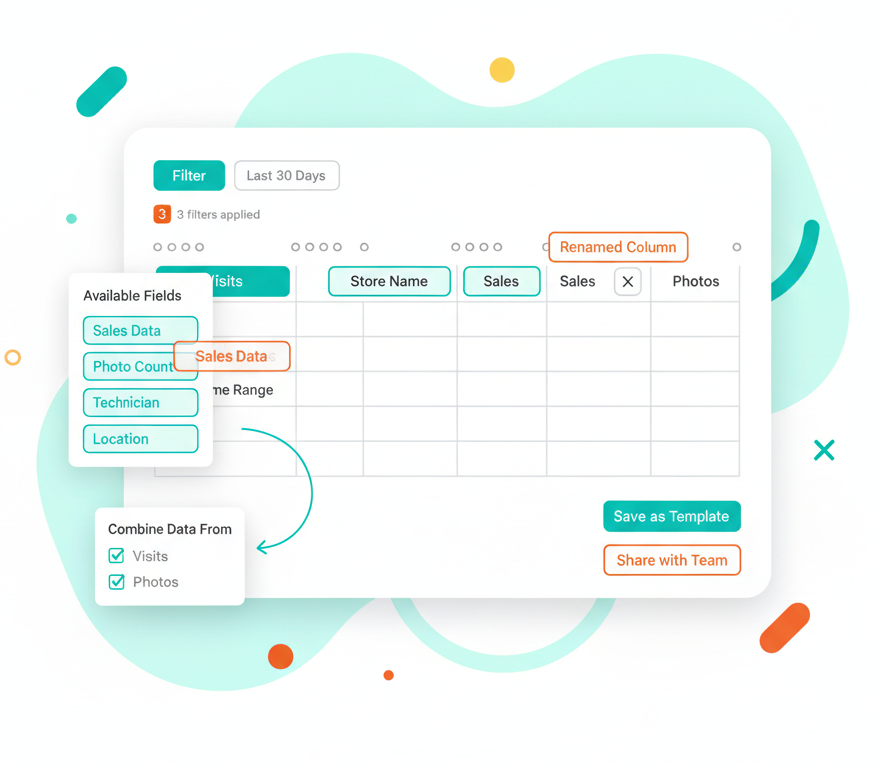
Custom Reports & Data Export
- Build custom reports by selecting and arranging the fields you need.
- Combine data from visits, tasks, sales, forms, photos, or inventory.
- Filter, group, and sort data to match any workflow.
- Export full datasets to Excel or CSV for deep analysis or BI tools.
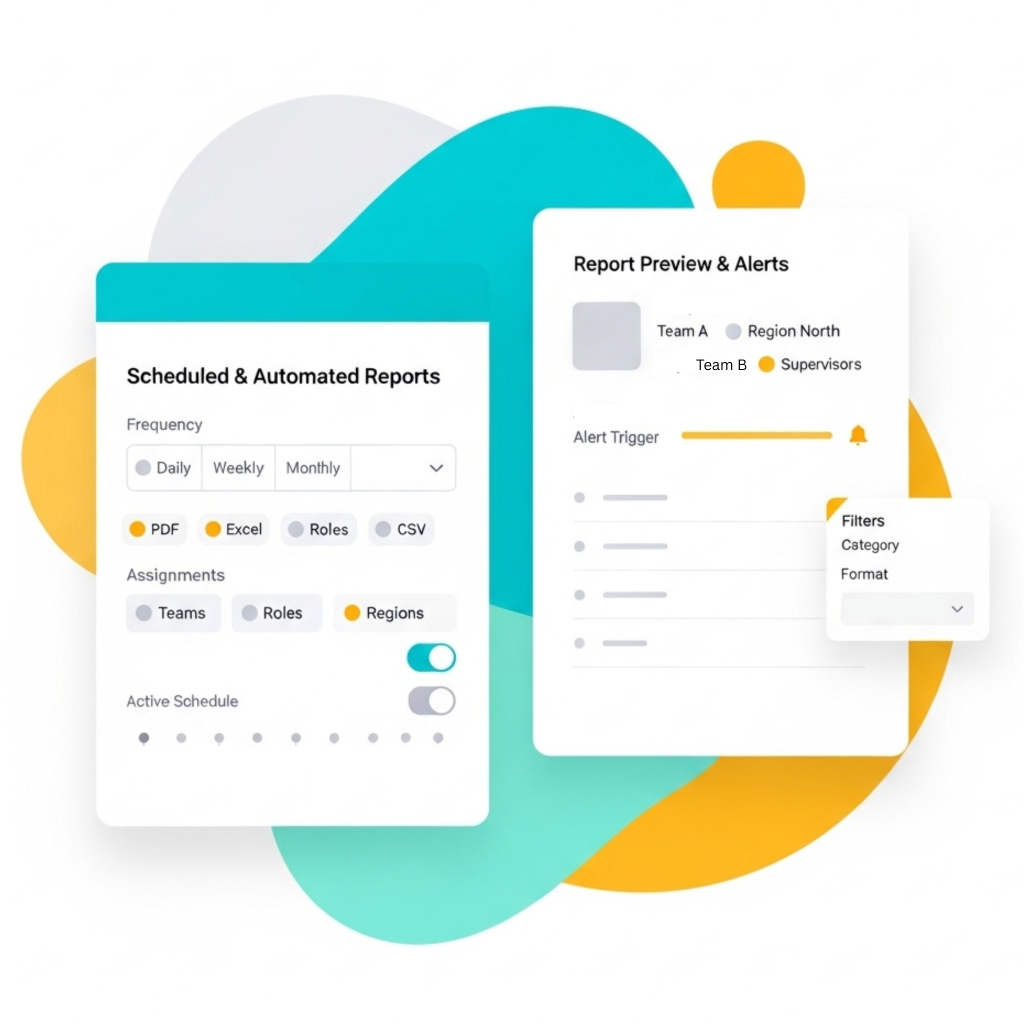
Scheduled & Automated Reports
- Send reports automatically on a daily, weekly, or monthly schedule.
- Choose PDF, Excel, or CSV file formats.
- Assign reports to specific teams, roles, or regions.
- Design workflows or alerts that trigger immediate action when specific field data requires urgent attention.
Role-Based Dashboards & Filtering
- Create dashboards with charts, tables, and KPI widgets.
- Control access so each role sees only the data relevant to them.
- Apply advanced filtering by time, customer, region, product, brand, category, or any custom field.
- Save frequently used dashboard views for quick access.
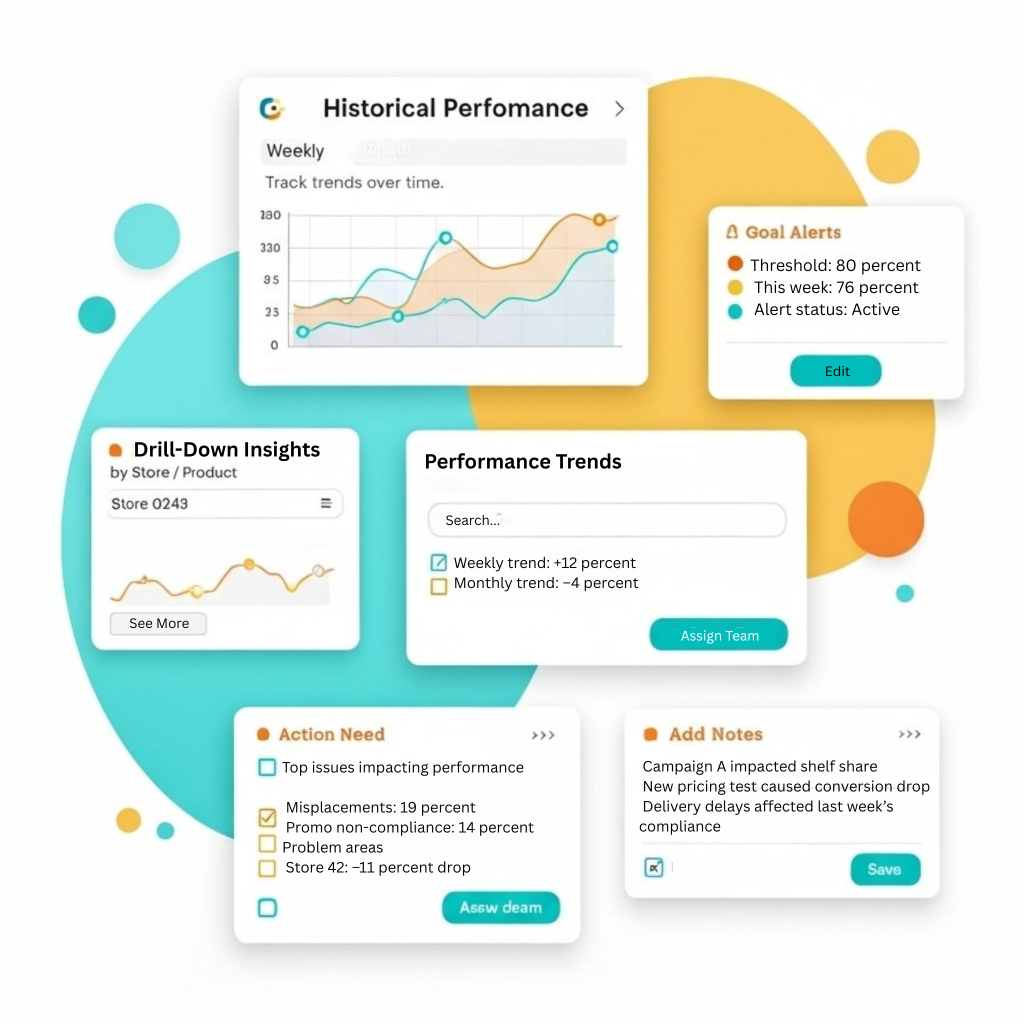
Historical Trends & Performance Analysis
- Track performance trends weekly, monthly, or yearly.
- Compare current performance with past results to understand changes.
- Drill down to specific stores, products, teams, or workflows.
- Share dashboards or reports easily via link or export.
Other Features


What Our Clients Say About FieldPie
We used to take notes of every visit in notebooks and then digitize them back at the office. Now, with FieldPie, I can record everything instantly regardless of whether I'm in the field or not. I can easily capture photos, chemical information, and customer notes. This system has significantly saved us time.


We have periodic maintenance agreements that require us to visit clients regularly each month. I used to rely heavily on a calendar to avoid missing appointments. Now, FieldPie sends us reminders, ensuring we arrive on time. Our customers are pleased, and we enjoy greater peace of mind.

FieldPie allows us to assign tasks, track representatives via GPS, and easily capture in-store data. The mobile app performs exceptionally well, even offline. Clients love the instant reports, and the dashboard provides us with real-time insights. It has simplified everything from forms to follow-ups.

We now manage quotes, bookings, and dispatch from a single platform. Our techs love the mobile app, especially its offline mode. Customers receive updates via text or email, and follow-ups are automated. The introduction of real-time reporting has made a significant difference.
FieldPie has taken a paper intensive business and streamlined every aspect. Efficiencies were created that I didn’t even know existed. We can take on so much more business, with our existing structure, all because of FieldPie.

As a sales organization, visibility is everything. FieldPie gives us a unified view of all visits, order history, photos, and store performance metrics. My reps walk into every meeting knowing exactly what happened last time and what to prioritize next. We’ve shortened our sales cycle and increased repeat orders across multiple regions.