


What is On-Shelf Availability (OSA)? On-shelf availability means a specific product is physically present on its designated retail shelf and ready for a customer to purchase at the moment they want it. OSA is measured as a percentage of time or SKUs a product remains purchasable in-store, making it one of retail’s most critical supply chain performance metrics.
Why Does On-Shelf Availability Matter in 2026?
Empty shelves are not a minor inconvenience — they are a direct revenue drain. When a shopper reaches for a product and finds nothing there, three things can happen: they buy a competitor’s brand, they leave the store empty-handed, or they abandon the retailer entirely. None of those outcomes benefit your business.
Research consistently shows that out-of-stocks cost the global retail industry approximately 8% of sales, with the figure rising closer to 10% during promotions. As RELEX Solutions notes, OSA has evolved from a store-floor metric into a boardroom-level supply chain priority — and for good reason. Retailers and suppliers who treat osa as a lagging indicator rather than a leading one consistently underperform against peers who monitor it in real time.
For brands selling through large-format retailers, osa is even more consequential. A single point of OSA improvement across a national chain can translate into millions of dollars in recovered revenue annually.
How Is On-Shelf Availability Calculated?
The standard OSA formula is straightforward:
OSA (%) = (Number of SKUs in stock on shelf ÷ Total number of SKUs that should be on shelf) × 100
| Metric | Description | Example |
|---|---|---|
| SKUs in stock on shelf | Products physically present and shoppable | 92 SKUs |
| Total expected SKUs | Full assortment per planogram | 100 SKUs |
| OSA Score | Calculated availability rate | 92% |
| Industry benchmark (grocery) | Typical retailer target | 95–98% |
| Best-in-class benchmark | Top-performing retailers | 98–99% |
Most large grocery and mass-merchandise retailers set an internal OSA target of 98% or higher. Falling below 95% is generally considered a performance red flag that triggers supply chain reviews, according to industry benchmarking data.

What Is the Difference Between OSA and In-Stock Rate?
This distinction trips up even experienced retail teams.
- In-stock rate measures whether inventory exists somewhere in the system — in the backroom, in transit, or in the distribution center.
- OSA measures whether the product is physically on the shelf, visible and reachable by the shopper.
A product can show 100% in-stock in your inventory management system while simultaneously registering 0% OSA. This gap is called phantom inventory — a scenario where the system believes stock exists, but the shelf is empty. Phantom inventory is one of the most expensive and frustrating problems in retail operations, and it is far more common than most teams realize.
Understanding this distinction is essential for any business that relies on instore execution to drive revenue. For a deeper look at how field teams can close this gap, explore our guide on instore execution best practices.
What Causes Poor On-Shelf Availability?
OSA failures rarely have a single root cause. They are almost always the result of compounding failures across the supply chain and instore operations.
Supply Chain Failures
- Forecasting errors: Demand planning models that fail to account for seasonality, promotions, or local events create replenishment gaps before products even reach the store.
- Supplier fill-rate issues: When vendors ship incomplete orders, distribution centers pass those gaps downstream to store shelves.
- Distribution center delays: Bottlenecks in the supply chain — whether from labor shortages, weather, or logistics failures — delay replenishment cycles.
In-Store Execution Failures
- Replenishment gaps: Store associates fail to pull backroom stock to the shelf on schedule, leaving inventory physically present but unavailable.
- Planogram non-compliance: Products placed in the wrong location create de facto out-of-stocks even when inventory is available.
- Phantom inventory: System records show stock on hand, but the product is lost, misplaced, or miscounted, preventing automatic reorder triggers.
- Shrinkage and theft: Unrecorded inventory loss degrades OSA without triggering replenishment.
As 8th & Walton’s supplier guide highlights, the most persistent OSA problems occur at the intersection of inaccurate inventory data and poor instore replenishment discipline — two issues that require both technology and process solutions.
Promotional and Seasonal Spikes
Promotions are the single highest-risk event for OSA. Demand surges that outpace planning lead to rapid shelf depletion, and marketing teams that fail to coordinate with supply chain teams create predictable failures. These events expose weaknesses in both demand planning and store-level execution simultaneously.
How Do You Measure On-Shelf Availability Accurately?
Measuring osa accurately requires more than a spot check. These are the primary methodologies in use today:
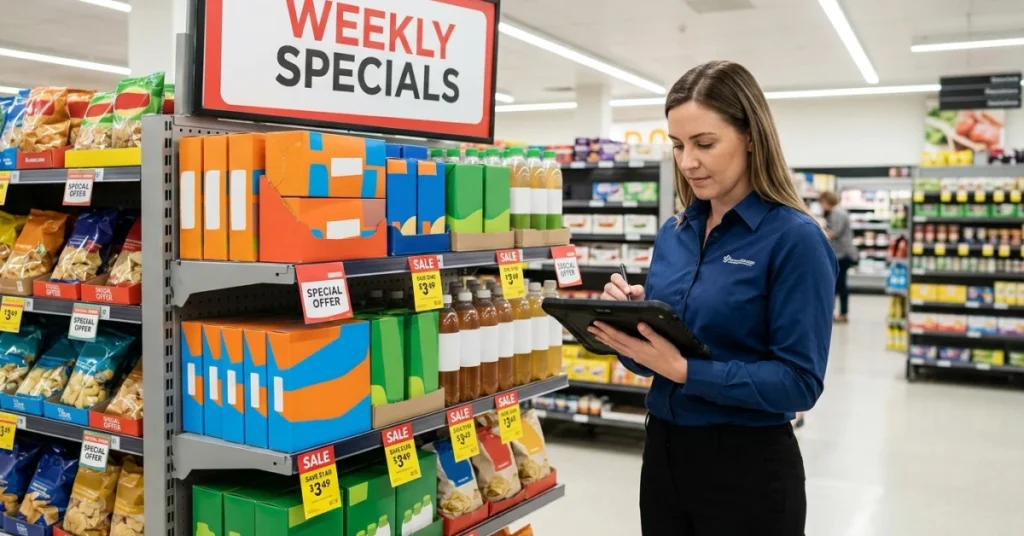
Manual Store Audits
Field merchandisers physically walk the store, check shelf conditions against planograms, and log gaps. This method provides high-quality, granular information but is expensive, time-consuming, and provides only a snapshot — not continuous visibility.
Point-of-Sale (POS) Data Analysis
Analyzing POS data for “zero-sales days” on active SKUs is a proxy method for detecting likely out-of-stocks. If a product that normally sells every day suddenly records zero sales, it is a strong signal of an OSA failure. This approach works at scale but can lag reality by 24–48 hours.
RFID and IoT Shelf Sensors
Radio-frequency identification tags and weight-sensitive shelf sensors provide near-real-time stock-level data without manual intervention. These technologies are becoming more viable as costs decline, particularly for high-velocity SKUs.
AI-Powered Image Recognition
Computer vision tools — deployed via store cameras or handheld devices — analyze shelf images to detect gaps, misplacements, and planogram violations automatically. This is increasingly the method of choice for retailers seeking scalable, continuous OSA monitoring without proportionally scaling labor costs, as Agmis documents in their retail analytics research.
How Can Retailers and Suppliers Improve On-Shelf Availability?
Improving osa requires coordinated action across supply chain planning, store operations, and data management. Here are the highest-impact levers:
1. Fix the Data Foundation First
OSA problems almost always have a data accuracy problem underneath them. Cycle counts, inventory reconciliation, and regular system audits are non-negotiable. Teams that accept inaccurate inventory data as a fact of life will never achieve sustained OSA improvement.
2. Tighten Demand Planning and Replenishment Cycles
Demand planning teams should incorporate promotional calendars, local events, and seasonal patterns into their replenishment models. Shortening replenishment cycle times — from weekly to daily where feasible — dramatically reduces the window during which a shelf can remain empty. Effective supply chain collaboration between retailers and suppliers is a proven driver of OSA improvement.
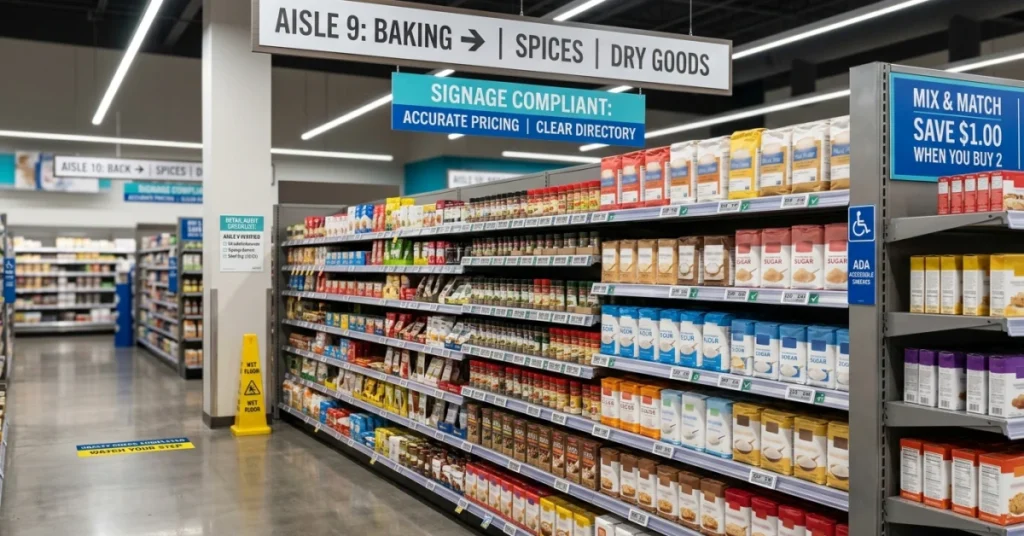
3. Standardize Instore Execution Processes
Store-level execution is where OSA is won or lost. Standardized replenishment routines, clear ownership of shelf-filling tasks, and regular planogram compliance checks are foundational. Using mobile field audit tools to track store compliance gives management teams the visibility they need to intervene before a gap becomes a lost sale.
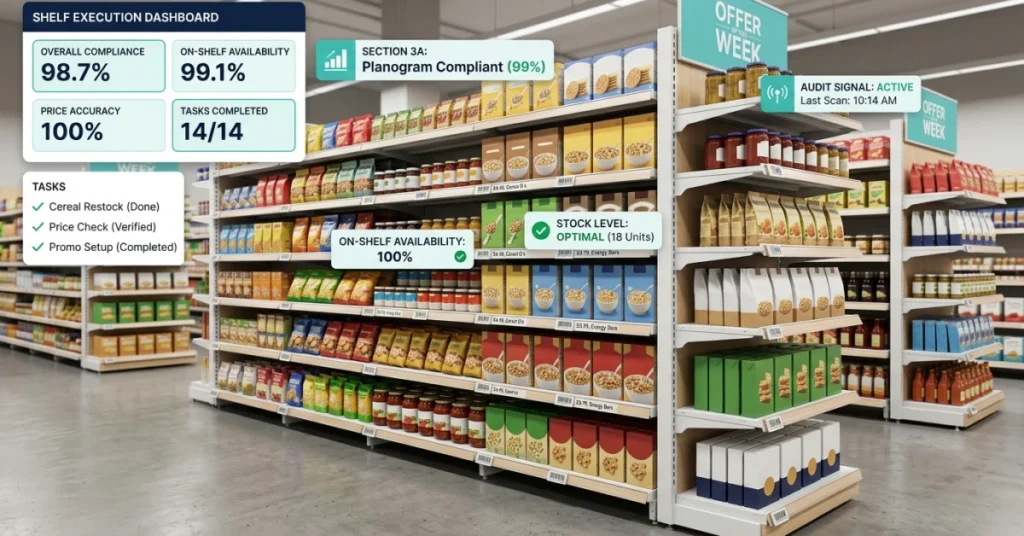
4. Deploy Technology for Continuous Monitoring
Manual audits cannot scale. Retailers and brands that consistently achieve 98%+ OSA invest in technology that monitors shelf conditions continuously — whether through IoT sensors, computer vision, or automated POS-based alerts. These systems allow teams to respond to out-of-stock events in hours rather than days.
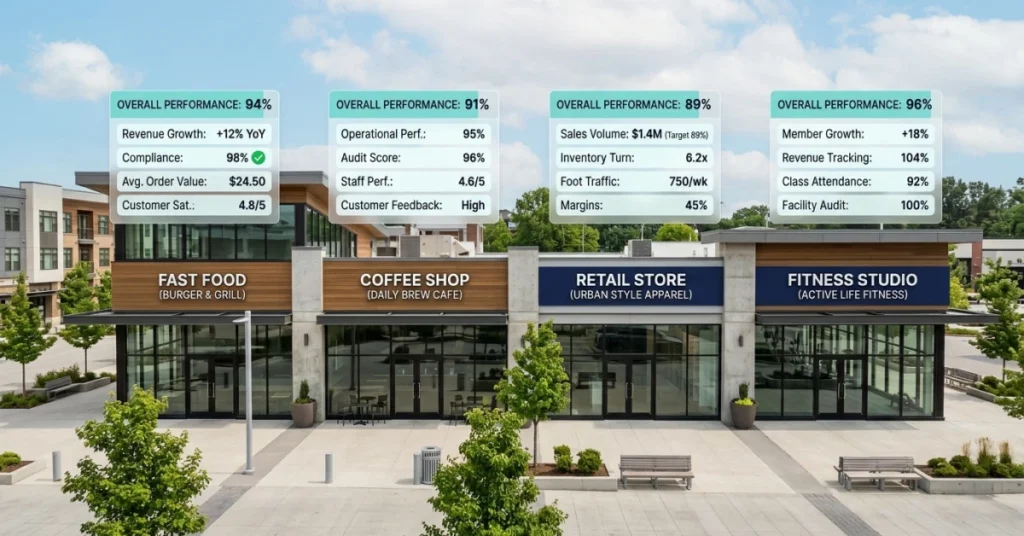
5. Align Cross-Functional Teams
OSA is not owned by any single department. Supply chain, store operations, marketing, and category management teams all influence it. Building shared dashboards and shared accountability — where all these teams can see the same osa data — removes the organizational silos that allow shelf gaps to persist.
For CPG brands managing field sales teams across multiple retail accounts, a centralized field sales management platform can unify data from store visits, inventory checks, and compliance audits into a single actionable view.
On-Shelf Availability Improvement Checklist
Use this checklist to audit your current OSA performance and identify priority improvement areas.
Supply Chain & Planning
- Demand planning models incorporate promotions, seasonality, and local events
- Supplier fill-rate performance is tracked and reviewed monthly
- Replenishment cycle times are reviewed and optimized at least quarterly
- Distribution center lead times are monitored against SLA benchmarks
- Supply chain collaboration protocols are in place with key retail partners
Inventory Management
- Cycle count schedules are maintained for all high-velocity SKUs
- Phantom inventory detection processes are active (POS zero-sales alerts or physical verification)
- Backroom inventory is organized and labeled for rapid shelf replenishment
- Shrinkage tracking is integrated into inventory management reporting
Instore Execution
- Planogram compliance is verified at each store visit
- Shelf-filling responsibilities and schedules are clearly assigned per store
- Store associates are trained on OSA standards and replenishment priorities
- Instore audit results are logged digitally and accessible to management in real time
- Promotional execution is verified against marketing calendars before and during events
Technology & Reporting
- OSA KPI is tracked at SKU, store, and regional level
- Automated alerts trigger when POS data signals a likely out-of-stock
- Field teams use mobile tools to log and escalate shelf gaps immediately
- OSA performance is reviewed in regular cross-functional business reviews

Frequently Asked Questions (FAQ)
What is a good on-shelf availability rate?
Industry benchmarks vary by category, but most large grocery and mass-merchandise retailers target 98% or higher for core SKUs. A rate below 95% is generally considered problematic and warrants immediate supply chain and instore execution review. Promotional periods require even tighter monitoring, as out-of-stock rates can double during high-demand events.
What is the difference between OSA and OOS (out-of-stock)?
OSA and OOS are inverse metrics. OSA measures the percentage of time or SKUs that are available on the shelf. OOS measures the percentage of time or SKUs that are not available. An OSA rate of 97% implies a 3% OOS rate. Both metrics are used in supply chain and retail operations management, but OSA is increasingly preferred in business reviews because it frames performance positively and aligns with customer experience goals.
Who is responsible for improving on-shelf availability?
OSA is a shared responsibility across multiple teams. Supply chain and demand planning teams own replenishment accuracy. Store operations teams own instore execution and shelf compliance. Marketing teams are responsible for coordinating promotional volumes with supply chain capacity. Category management teams own planogram accuracy. In practice, the most effective OSA improvement programs establish a cross-functional working group with shared KPIs, shared data access, and clear escalation paths when shelf gaps are detected.
Conclusion
What is On-Shelf Availability at its core? It is the measurable gap between what a customer expects to find on a shelf and what is actually there. Every percentage point below your OSA target represents lost revenue, a damaged customer relationship, and a weakened position with your retail partners.
Achieving and sustaining high OSA requires accurate inventory data, disciplined supply chain planning, standardized instore execution, and technology that gives your teams real-time visibility into what is happening at shelf level. None of these elements works in isolation — and that is precisely why osa remains one of the hardest metrics to consistently improve.
The businesses that get it right share a common approach: they treat OSA as a cross-functional priority, invest in the tools that surface problems early, and build the accountability structures that ensure problems get fixed before they cost sales.


