✦ Key Takeaways
Companies that track technician productivity see up to 30% higher billable hours within the first year.
→ Untracked idle time costs service businesses thousands monthly.
→ The right metrics reveal who your top performers actually are.
→ Automated tracking cuts manual reporting time by half.
In this article:
What Is Technician Productivity Tracking?
Key Technician Productivity Metrics
How to Track Technician Productivity
Key takeaway: Measure your technicians precisely or watch profit silently drain from your operation.
What Is Technician Productivity Tracking?
Most field service teams think they have a productivity problem. They actually have a measurement design problem.
The metrics you choose shape how technicians behave on the job. How you surface those metrics matters just as much.
Technician productivity tracking means capturing, measuring, and acting on data about how well technicians complete field work. It goes far beyond logging hours or counting closed tickets.
A bad tracking system doesn’t just miss the real picture. It actively creates the inefficiency it claims to measure. Technicians end up chasing the metric instead of the outcome.
The same dynamic plays out in merchandiser productivity tracking, where surface-level metrics routinely mask execution gaps.
Productivity vs Technician Utilization
Utilization measures whether a technician was busy. Productivity measures whether that busyness produced real results.
Mixing up the two is one of the most common — and costly — mistakes in field service management.
A technician can run at 95% utilization and still deliver poor outcomes. That happens when the work itself is misdirected. Tracking field service technician productivity means measuring value delivered, not just time spent.
Why Productivity Tracking Matters for Field Service Teams
Companies that monitor employee performance see up to a 20% gain in output without adding headcount (according to Worktime). That gain only holds when the tracking system measures the right things — not just presence.
Item notes that technician performance KPIs must connect directly to service outcomes. Activity logs alone don’t cut it.
Without that link, the data shows how hard people worked. It won’t show how well.
Ask yourself this: are your technician productivity metrics pointing your team toward better work? Or just more of it?
Key Technician Productivity Metrics
Wrong Metrics Create Real Waste Tracking ticket count alone hides whether technicians actually solve problems or just close tickets.
First-Time Fix Rate Is Critical Top field service teams hit a first-time fix rate above 80%. That cuts costly repeat visits fast.
Travel Time Eats Billable Hours Technicians on poor routes spend up to 40% of their day driving, not working.
Metrics Shape Behavior Directly The KPIs you show every day decide how technicians spend their time and effort.
The real question isn’t what to measure. It’s which metrics actually change how work gets done.
Pick the wrong ones, and your tracking system builds the very waste it was meant to fix.
Jobs Completed per Day
Jobs completed per day looks like a clean number. But without context — job complexity, drive distance, parts availability — it rewards speed over quality.
Use it as a baseline, not a scorecard. Pair it with outcome metrics or it will push technicians to rush.
First-Time Fix Rate
This is one of the strongest signals in technician performance KPIs. A low first-time fix rate means repeat truck rolls, unhappy customers, and wasted labor hours.
Top teams push this rate above 80%. They get there by tracking it openly — not by pushing technicians to close tickets faster (Oxmaint).
Average Job Completion Time
Average job completion time shows where your process breaks down. Long times often point to missing parts or unclear work orders — not slow workers.
Fix the system first. Then watch the numbers move on their own.
Travel Time vs Productive Time
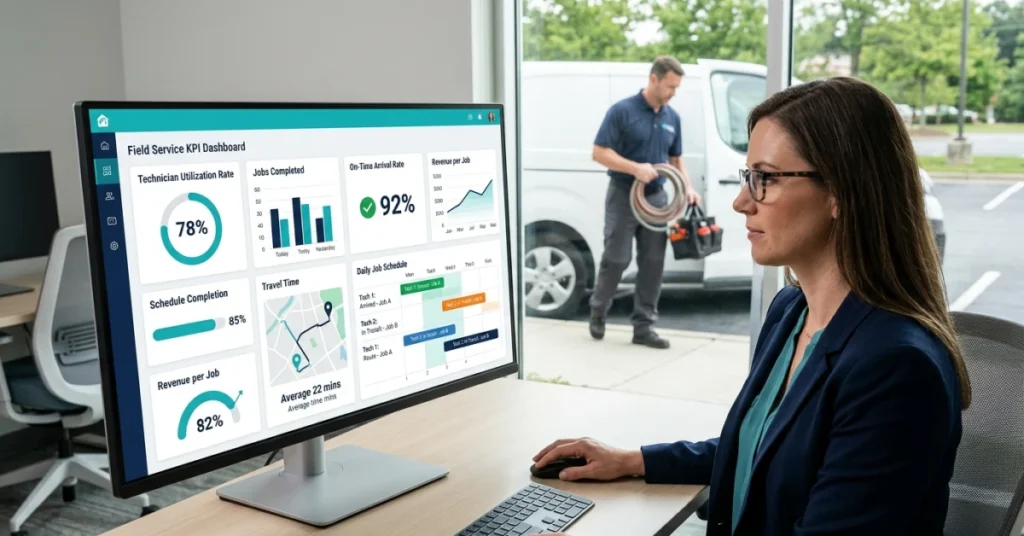
Field service productivity lives and dies by this ratio. Technicians on poor routes can spend 40% of their day in a vehicle. That time generates zero revenue.
Measuring this split is the fastest way to find hidden capacity. The same lesson applies across mobile workforces, which is why merchandiser productivity tools treat route efficiency as a core metric.
Billable Hours and Utilization Rate
Utilization rate is billable hours divided by total available hours. It is the clearest link between measuring technician productivity and actual revenue.
Most service businesses target 75–85% utilization as a healthy range. This metric exposes scheduling gaps and idle time managers often miss until the month-end report (Autosoftway).
Repeat Visits and Callback Rate
A high callback rate directly cuts into your margins. Every repeat visit burns labor, fuel, and scheduling capacity that could serve a new customer.
Track callbacks by technician and by job type. Patterns here reveal training gaps faster than any performance review will.
Knowing which metrics matter is only half the work. The harder question is how you capture this data without turning your technicians into data-entry clerks.
How to Track Technician Productivity
The metrics you pick don’t just measure behavior — they create it. A technician tracked on ticket count will close tickets fast. But a slower fix often prevents three callbacks.
Most teams default to hours logged and jobs completed. Those numbers hide more than they reveal. Technician productivity tracking only works when you build the system around outcomes, not activity.
📊 By the Numbers
Teams that track outcome-based KPIs see up to 25% fewer repeat service calls within 90 days.
Set Role-Specific Productivity Benchmarks
An HVAC tech and a network installer do very different work. One benchmark can’t cover both. Set technician performance KPIs by role, not by department.
Benchmarks give technicians a clear target. That shapes daily decisions before a manager ever reads a report.
Vague standards produce vague effort.
Capture Work, Travel, and Waiting Time
Wait time logged as work time makes the data look fine. Meanwhile, the operation bleeds.
Separate these three categories in every time log. Keep them distinct — always.
Over 80% of lost field hours trace back to untracked idle and travel time (Factorialhr). You can’t fix what you can’t see.
Compare Scheduled Time with Actual Results
Schedule adherence is one of the sharpest technician productivity metrics available. It shows whether planning is realistic or just hopeful.
Compare booked time against actual job length every week, not every quarter. This is why merchandiser productivity tracking uses schedule-vs-actual as a core signal. The same logic applies across all field roles.
Patterns surface fast when you check the gap often.
Review Performance and Assign Follow-Up Actions
Data without a review loop is just storage. Perwatch reports that workers who get regular feedback are 14% more productive than those who don’t.
Every review must end with a specific next action. A general note to “improve” is not enough.
Measuring technician productivity means closing the loop. Opening the dashboard is just the start.
Ask whether your system rewards the right things. Accurate data can still mislead you. It happens when the setup quietly rewards the wrong behavior.
Conclusion
When outcomes drive your metrics, repeat calls drop. Technician productivity tracking finally reflects real performance — not just activity.
The system you build shapes the behavior you get. Design it with that in mind.
Most field teams still guess at productivity. Their tracking captures presence, not results.
Worktime reports that only 60% of tracked work time ties to productive output. That gap lives inside poorly designed tracking systems — not lazy technicians.
Most managers can’t close that gap. Their tools scatter job data, schedule data, and technician performance KPIs across disconnected systems. That makes outcome-based decisions slow and unreliable.
FieldPie pulls scheduling, job tracking, and real-time field data into one platform. Managers see outcome-based metrics the moment a job closes — not days later.
Teams that shift to outcome-focused field service technician productivity tracking report up to 25% fewer repeat service calls within the first quarter. That result shows up fast. Start by replacing one activity metric with one outcome metric this week.