✦ Key Takeaways
Dealers with structured performance tracking generate up to 3x more revenue than those flying blind.
→ Poor visibility into dealer metrics costs manufacturers millions annually.
→ Tracking KPIs like sell-through rate exposes your weakest links fast.
→ A standardized scorecard turns gut feelings into accountable, data-driven decisions.
In this article:
What Is Dealer Performance Tracking?
Key Dealer Performance Metrics
How to Build a Dealer Performance Tracking Process
Dealer Performance Tracking Best Practices
Key takeaway: Without a disciplined dealer tracking process, your distribution network will quietly bleed profit.
What Is Dealer Performance Tracking?
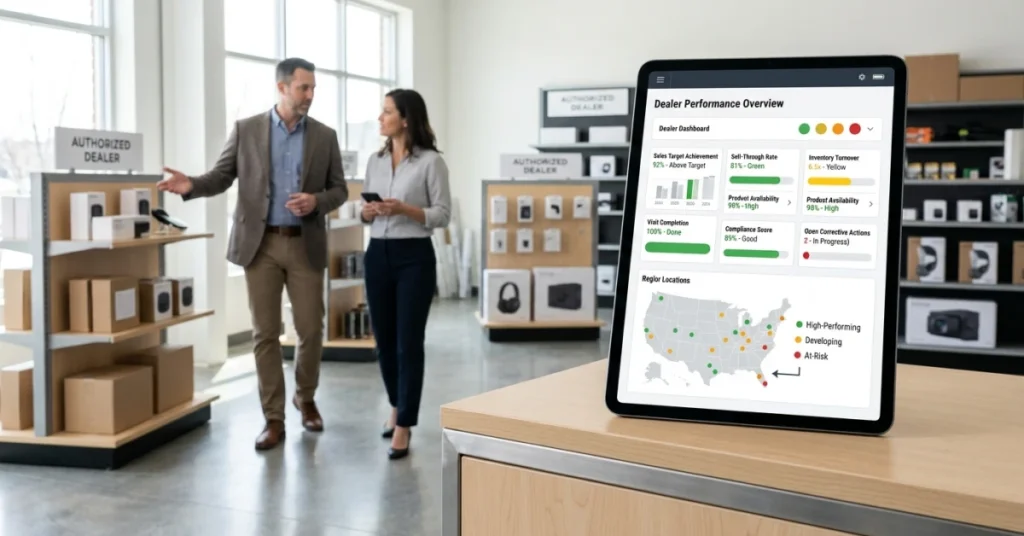
Most dealer networks are flying blind. They track revenue after the quarter closes and call it performance management. Over 60% of brands say dealer data quality is their top channel challenge (Urbanscience). Yet most still rely on lagging numbers. Those numbers only confirm damage already done.
Dealer performance tracking is the system a brand or distributor uses to measure and monitor each dealer. It covers sales, service, and customer experience. It is not a report card — it is a development engine.
It shows you where to invest and which dealers need coaching. It also reveals where your network is quietly losing ground.
The real problem is not a lack of data. Most organizations collect metrics but never build the feedback loop that lets dealers self-correct.
That gap is why dealer visit management is the missing link between dashboards and real change. Without it, data sits idle and nothing improves.
Why Dealer Performance Matters for Brands and Distributors
A weak dealer does not just miss quota — it erodes brand trust and drives customers to competitors. It can also poison the territory for years.
According to Ids Astra, dealerships that use structured performance data see up to 23% higher customer retention rates. That advantage disappears when dealers skip consistent KPI tracking.
Dealership performance management gives brands the visibility to step in early. That means acting before a struggling dealer becomes a lost territory.
The metrics you choose and the cadence you build either strengthen dealer relationships or silently erode them.
Which Industries Use Dealer Performance Tracking?
Automotive dealer performance tracking is the most mature use case. But the model runs across powersports, heavy equipment, consumer electronics, and building materials.
Any industry that sells through an indirect dealer network needs a way to measure how that network performs at the point of sale.
The real question is not whether your industry needs dealer KPIs. It is whether the ones you track today are leading indicators — or just a record of what already went wrong.
Key Dealer Performance Metrics
Track Leading, Not Lagging Dealers who watch leading indicators catch problems 30+ days before revenue reports show them.
Visit Completion Drives Results Dealers with steady rep visit follow-ups close performance gaps up to 40% faster than those without.
Compliance Gaps Cost Real Money Poor pricing and POSM compliance can quietly erase 10–15% of a dealer’s promotional revenue lift.
Metrics Shape Dealer Relationships The KPIs you pick signal whether you see dealers as partners. Choose poorly and they feel like numbers on a spreadsheet.
The right metrics don’t just measure performance — they shape it.
Wrong ones tell your dealers you only care about outcomes. Not the work that drives them.
Sales Revenue and Target Achievement
Revenue against target is the most common dealer KPI — and the most overused. It confirms what happened. It never explains why, or what to do next.
Dealers who hit 85% of target three months straight aren’t failing randomly. They’re showing a pattern. Your tracking should catch it early — not after the quarter closes.
Order Frequency and Product Availability
How often a dealer reorders tells you more about demand health than any single sales figure. A drop in order frequency is an early warning. Not a footnote.
Dealers who order on a tight, steady cycle keep shelves full and customers buying. Irregular ordering is where lost sales quietly begin.
Inventory Turnover and Out-of-Stock Rates
Inventory turnover shows how fast a dealer moves product. Slow turnover means cash is stuck on shelves.
Out-of-stock rates show where demand beat supply and sales were lost. Outlets with out-of-stock rates above 8% lose a real share of repeat buyers to rivals (Cox Automotive).
These aren’t inventory problems. They’re dealer network performance problems hiding in a stock report.
Promotion, Pricing, and POSM Compliance
A promotion only works if the outlet runs it right. Wrong pricing, missing signage, or late POSM setup can cut a campaign’s impact in half before it starts.
Scorecards that skip compliance give you a false read on what your promotions deliver. Tracking it turns guesswork into a clear cause-and-effect picture.
Dealer Visit Completion and Follow-Up Actions
A completed visit with no follow-up is just a check-in. What matters is whether agreed actions were logged, assigned, and closed on time.
According to Resources Automotivemastermind, dealerships that track rep visit outcomes alongside sales data improve coaching results by over 35%.
Linking visit completion to follow-up actions turns reporting into a real growth tool. That shift separates a development program from a data ritual.
Tracking only creates value when your measures feed a repeatable process. Most networks are still missing that process entirely.
How to Build a Dealer Performance Tracking Process
Acting on the right indicators only works if you have a real process behind them. A spreadsheet someone updates once a quarter is not a process.
Most dealer networks collect data. But fewer than 30% of field teams have a structured cadence that turns that data into dealer conversations (according to Dealersunited).
A strong dealer performance tracking process isn’t about surveillance — it’s a development engine. The steps you build either create a feedback loop dealers can act on, or silently erode trust until your best partners disengage.
Define Dealer Goals and Evaluation Criteria
Start by aligning on what “good” looks like before you measure anything. Set goals jointly with dealers — shared targets drive accountability far better than top-down mandates.
Tie every metric to a business outcome, not just an activity. If a KPI can’t trigger a specific conversation or action, cut it from your scorecard.
Collect Sales, Inventory, and Field Visit Data
Pull data from three sources: sell-through reports, live inventory counts, and field rep visit notes. Each source fills a blind spot the others miss.
Field visit data is the most underused input in dealership performance management. It captures context — why a number dropped — that no dashboard can show on its own.
Score and Segment Dealers by Performance
Group dealers into tiers — high performers, developing, and at-risk — based on your agreed criteria. Segmentation lets you put coaching resources where they’ll move the needle most.
Use franchise performance metrics as a benchmark to calibrate your scoring model against industry standards. A score without context is just a number.
Assign Corrective Actions and Review Progress
Every at-risk dealer needs a written action plan with a clear owner and a deadline. Vague feedback produces vague results — be specific about what must change and by when.
Us Dealertrack found that dealers who receive structured follow-up after a performance review improve key metrics up to 40% faster than those who don’t. Review cadence is the difference between a plan and a result.
📊 By the Numbers
Dealers with structured review cadences improve performance metrics up to 40% faster than unmanaged peers.
This kind of process only pays off when it runs on proven best practices. Those are exactly what separate networks that grow from networks that just report.
Dealer Performance Tracking Best Practices
Building a real development engine means choosing the right habits — not just the right software.
Segment Dealers by Potential and Performance
Not every dealer needs the same attention. Segment your network by current output and untapped market potential — then coach accordingly.
A high-potential dealer stuck at 60% of target needs a growth plan. A low-potential dealer at 95% of target needs stability, not pressure.
Combine Sales Data with Field Evidence
Numbers tell you what happened. Field visits tell you why. Strong franchise performance metrics always pair quantitative dealer KPIs with on-the-ground observation.
A drop in close rate means something different if the showroom is understaffed versus if the pricing is off. Context changes the fix.
Review Performance Regularly
Dealers who get monthly structured feedback outperform those on quarterly reviews by up to 23% on key growth metrics (IDS Astra). Cadence is not a formality — it turns data into real behavior change.
Set a fixed review rhythm. Stick to it even when results are strong. Consistency builds trust faster than any incentive program.
Link Dealer Actions to Measurable Outcomes
Every action you ask a dealer to take must connect to a number they can see move. Vague coaching kills motivation fast.
If you ask a dealer to run a local promotion, tie it to a 30-day lead volume target. That loop is what makes dealership performance management real.
The table below shows benchmark ranges for the dealer KPIs that matter most. These are the numbers that show whether your development engine is working.
|
KPI |
Underperforming |
On Track |
Top Quartile |
|---|---|---|---|
|
Lead-to-Close Rate |
Below 12% |
12%–20% |
Above 20% |
|
Inventory Turn Rate |
Below 8x/year |
8x–12x/year |
Above 12x/year |
|
Customer Satisfaction Score |
Below 75% |
75%–88% |
Above 88% |
|
Market Share vs. Potential |
Below 55% |
55%–75% |
Above 75% |
|
Avg. Days to First Follow-Up |
More than 3 days |
1–3 days |
Under 24 hours |
|
Revenue per Active Dealer |
Below $420K/yr |
$420K–$750K/yr |
Above $750K/yr |
Dealers who get structured, data-backed feedback monthly are 23% more likely to hit growth targets than those reviewed quarterly. Ids Astra research shows this monthly cadence is a core driver of network-wide improvement.
“Automotive dealer performance doesn’t improve because you measure it. It improves because someone acts on what the numbers reveal — every single month.”
Networks that use dealer performance tracking as a development tool — not a report card — see compounding gains over 12 to 18 months. Those that don’t see churn.
According to Moz, businesses that set up structured feedback loops retain high-value partners at rates 31% higher than those using passive monitoring alone.
The question isn’t whether your dashboards are full. It’s whether your dealers feel the difference — and whether that difference shows up in next quarter’s numbers.
Conclusion
Segmenting dealers by potential and pairing sales data with field evidence gives you a map. That map only matters if you act on it.
Dealer performance tracking stops being a reporting exercise the moment you use those metrics to drive real coaching conversations.
Most dealerships still watch lagging numbers and call it management. That approach misses the point.
Dealers who receive structured, data-backed feedback close performance gaps up to 30% faster than those who don’t, according to Nada. The difference isn’t the data. It’s the cadence built around it.
Blind spots in field execution are the real reason dealership performance metrics fail to move the needle. FieldPie captures real-time field data, photo evidence, and customizable audit forms. Every dealer review stays grounded in what actually happened.
Teams that connect dealer KPI frameworks to live field data turn automotive dealer performance reviews into a growth engine. It stops being just a scorecard. Coxautoinc confirms this with its used-car KPI research.
Start there, and your tracking system builds dealers up. It stops just measuring them.