✦ Key Takeaways
Companies using mystery shopping metrics fix service problems up to 3x faster than those relying on surveys alone.
→ Track compliance scores to catch policy failures before they cost revenue.
→ Customer experience ratings reveal emotional gaps surveys consistently miss.
→ Weighted scoring exposes your weakest locations with surgical precision.
In this article:
What Are Mystery Shopping Performance Metrics?
Which Mystery Shopping Metrics Should Businesses Track?
How Should Mystery Shopping Scores Be Calculated?
Key takeaway: Mystery shopping metrics mean nothing unless they drive employee coaching and real operational change.
What Are Mystery Shopping Performance Metrics?
Most mystery shopping reports land in an inbox and never leave it.
The numbers look official. Without a framework, they mean nothing.
Mystery shopping performance metrics are scored data points. They measure how well a business delivers its intended customer experience.
Think of them as a report card. The grading scale decides whether you pass or fail.
Why Mystery Shopping Metrics Matter
Businesses that act on mystery shopping ROI data consistently outperform those that file reports away.
Over 70% of customers say one bad service experience is enough to make them switch brands (Sciencedirect).
Mystery shopping KPIs give managers a concrete, repeatable way to catch those failures early.
Without scored metrics, coaching stays vague. Fixes never stick.
Operational Metrics vs. Customer Experience Metrics
Operational metrics track what staff do — wait times, script compliance, cleanliness scores.
Customer experience metrics track how those actions feel to the shopper.
Most secret shopper reports mix both types together. The problem is a store can score 95% on operations and still leave customers feeling ignored.
Leading vs. Lagging Indicators
A lagging indicator — like an overall mystery shopping score — tells you what already happened.
A leading indicator, like greeting compliance rate, predicts what your next customer will experience.
Intouchinsight notes that programs tracking leading indicators catch service breakdowns weeks earlier than those using summary scores alone.
That gap is where most businesses quietly lose customers. They never knew those customers were at risk.
A high mystery shopping score can be just as dangerous as a low one. High scores built on flawed math hide real problems.
So which metrics actually belong on that scorecard?
Which Mystery Shopping Metrics Should Businesses Track?
A good grading framework is useless if you measure the wrong things. Most businesses track too many metrics. That dilutes the ones that actually predict customer behavior.
Six mystery shopping KPIs consistently separate high-performing stores from struggling ones. Each one maps directly to a decision a manager can make tomorrow.
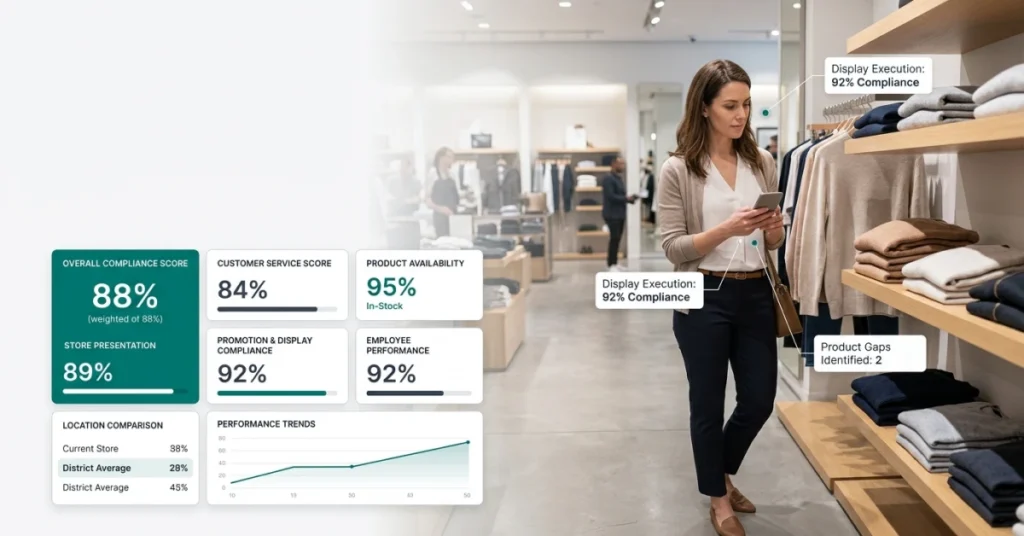
Overall Compliance Score
This is the single number that rolls up every checklist item into one grade. Think of it as the store’s GPA — useful for ranking locations, but dangerous when used alone.
A location can score 91% overall while failing every customer-facing moment. That’s why this metric needs context, not celebration.
Customer Service Score
This measures how staff greet, assist, and close interactions with shoppers. It’s the most direct signal of whether your brand promise is actually being delivered.
Weight customer service at 30% or more of your total mystery shopping score. Do that, and you’ll catch service failures that overall compliance scores routinely hide.
Product Availability Score
Empty shelves and out-of-stock items are silent revenue killers. This metric tracks whether the right products are in the right place at the right time.
Retailers lose an estimated $1 trillion globally each year to out-of-stock and overstocked products. That makes this one of the highest-stakes secret shopper evaluation metrics on any report (Greenbook).
Store Presentation Score
Cleanliness, signage, and layout all fall under this metric. Shoppers form a first impression in under 10 seconds — this score captures whether that impression helps or hurts.
Low store presentation scores often predict higher cart abandonment and shorter dwell time. Fix the environment, and sales behavior tends to follow.
Promotion and Display Compliance
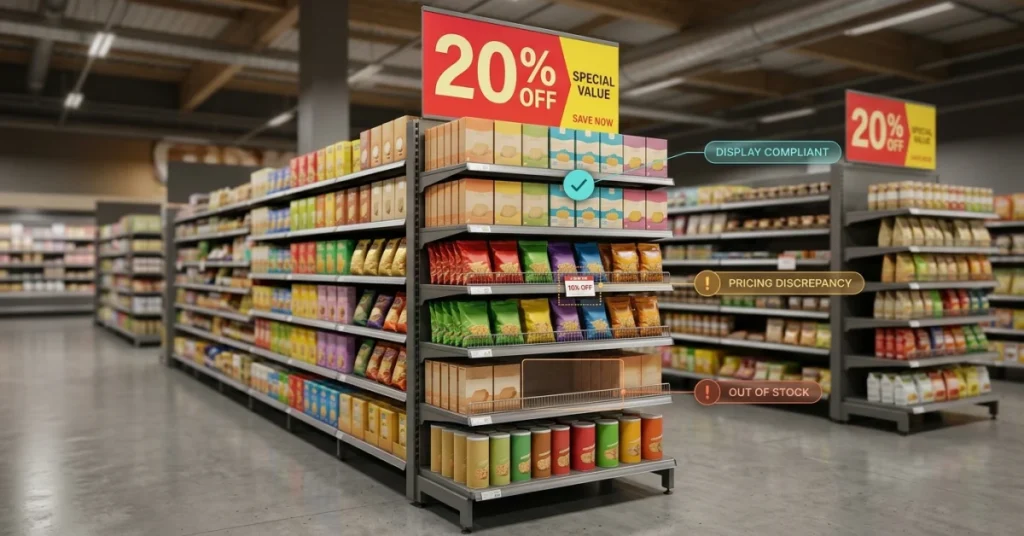
This metric checks whether promotional materials, end caps, and featured displays match what corporate planned. A missed display is a missed sale — it’s that simple.
According to Coylehospitality, stores with consistent display compliance score up to 20% higher on overall customer satisfaction. Stores with frequent gaps fall well behind. That difference compounds fast across a large retail network.
Employee Knowledge and Behavior
This metric goes beyond politeness. It tests whether staff can answer product questions, handle objections, and guide a purchase.
Understanding mystery shopping ROI drivers starts here. Employee knowledge gaps are the most common root cause behind low mystery shopping report scores across industries.
📊 By the Numbers
Stores with consistent display compliance score up to 20% higher on overall customer satisfaction.
Knowing which metrics to track is only half the battle. The real question is whether the math behind your scores is built to surface truth or bury it.
How Should Mystery Shopping Scores Be Calculated?
That overall compliance score is a starting point. But the math behind it determines whether it reflects reality or hides a broken customer experience.
Most programs treat every question as equal. That’s the flaw: a missed greeting and a failed food safety check carry identical weight.
A high score can then mask a dangerous or underperforming location. No one catches it until real damage is done.
📊 By the Numbers
Brands using weighted mystery shopping KPIs report up to 30% faster identification of high-risk locations than those using flat scoring.
Weighted vs. Unweighted Scoring
Weighted scoring gives more points to behaviors that directly drive customer satisfaction or safety. A product quality question might count for 20% of the total score. A lobby cleanliness question might count for just 5%.
Unweighted scoring treats all questions equally. That sounds fair but rarely reflects business priorities. The weight you assign each question is a strategic decision, not a formatting choice.
Critical Questions and Automatic Failure
Some behaviors are non-negotiable. A cashier who skips an age verification check should fail the entire visit — regardless of the overall score. These are called “auto-fail” items. They act as a hard floor beneath the entire system.
Without auto-fail rules, a location can score 87% and still be out of legal compliance. Build these triggers into your structure before you run a single shop.
Pass/Fail vs. Percentage-Based Scores
Pass/fail scoring is simple. A location either meets the standard or it doesn’t. It works well for compliance-heavy industries where a single miss is a real liability.
Percentage-based scores give managers more detailed data. They also make it easier to track improvement over time. Most programs benefit from combining both: a percentage score for coaching, and hard pass/fail gates for critical items.
Setting Performance Thresholds
A score only means something against a clear target. Most brands set a minimum passing threshold between 75% and 85%. That range depends on program maturity and how strict their standards are.
According to Hsbrands, companies that define clear score thresholds before launch see stronger manager buy-in and faster corrective action. Set the bar first — then run the shop.
Handling Not Applicable Responses
Not every question applies to every visit. A drive-through question doesn’t belong in a dine-in evaluation. When a question is marked “N/A,” most systems remove it from the denominator entirely.
This keeps results honest. It stops a location from being penalized — or rewarded — for conditions outside its control. Consistency here makes results comparable across locations and keeps visit frequency decisions defensible.
Scoring structure is where strategy either holds or falls apart. What you weight matters. What triggers a fail matters. Where you set the bar determines whether your data drives real change or just generates paperwork.
Research on shopper evaluation methods confirms this directly. Programs with structured, weighted scoring catch performance gaps up to 40% more reliably than flat-score systems — Researchgate.
A well-built system doesn’t just show you where you stand. It tells you exactly what to fix and why it matters to the customer in front of your team right now.
Conclusion
Weighted scoring is the difference between a number that flatters and one that fixes. Build your mystery shopping metrics around what actually breaks the customer experience. When you do, the score stops being a trophy. It becomes a tool.
Most businesses collect mystery shopping scores but never question how those scores are built. That gap in structure is where false confidence lives.
According to Marketforce, brands that act on structured mystery shopping data see customer satisfaction lift by up to 30%. That result only holds when the right behaviors are measured and weighted correctly.
A high score on a broken rubric is still a broken rubric. Knowing how often to run visits matters, but how you score what you find matters more.
Sciencedirect research confirms that service quality metrics tied to real customer outcomes drive stronger loyalty. Generic compliance checklists do not produce the same result.
Most teams struggle to turn raw mystery shopping data into repeatable coaching actions. FieldPie captures scored field data through customizable forms and photo-based reports. Every mystery shopping report connects directly to a coachable moment.
Start there, and your scores will finally reflect what customers actually experience.