✦ Key Takeaways
Brands waste up to 72% of trade promotion budgets on campaigns that never lift incremental sales.
→ Poor measurement leaves billions in promotion ROI unaccounted for annually.
→ Baseline sales separation reveals true lift versus natural demand cycles.
→ Tracking sell-through rate exposes which promotions actually move product.
In this article:
What Is Trade Promotion Effectiveness?
How Do You Measure Trade Promotion Effectiveness?
Which Metrics Should You Track for Trade Promotion Effectiveness?
Key takeaway: Measuring trade promotion effectiveness with the right metrics is the only way to stop burning money.
What Is Trade Promotion Effectiveness?
Brands pour over $500 billion a year into trade promotions globally — yet most can’t say whether those promotions actually worked. That’s not a data problem. It’s a definition problem.
Most companies measure success by total sales volume during a promotion window. That number almost always looks good.
But it tells you nothing about whether the promotion created demand or simply borrowed it from next week.
How Trade Promotions Drive Retail Sales
A trade promotion is any deal a brand offers a retailer. It can be a price cut, a display, or a feature ad — all designed to move product off shelves faster.
Done right, it pulls new buyers in and grows the category. Done wrong, it just shifts the same loyal shoppers to a cheaper price.
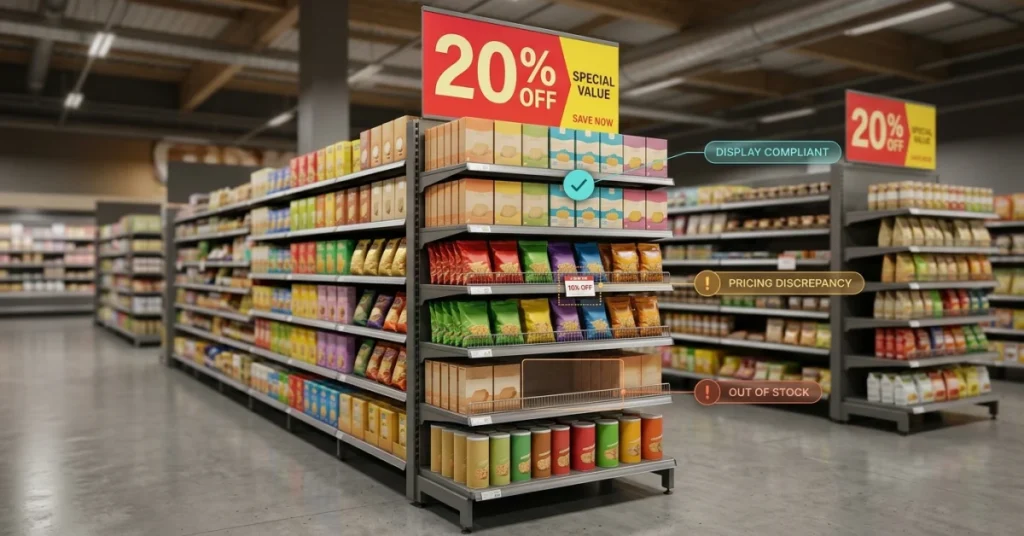
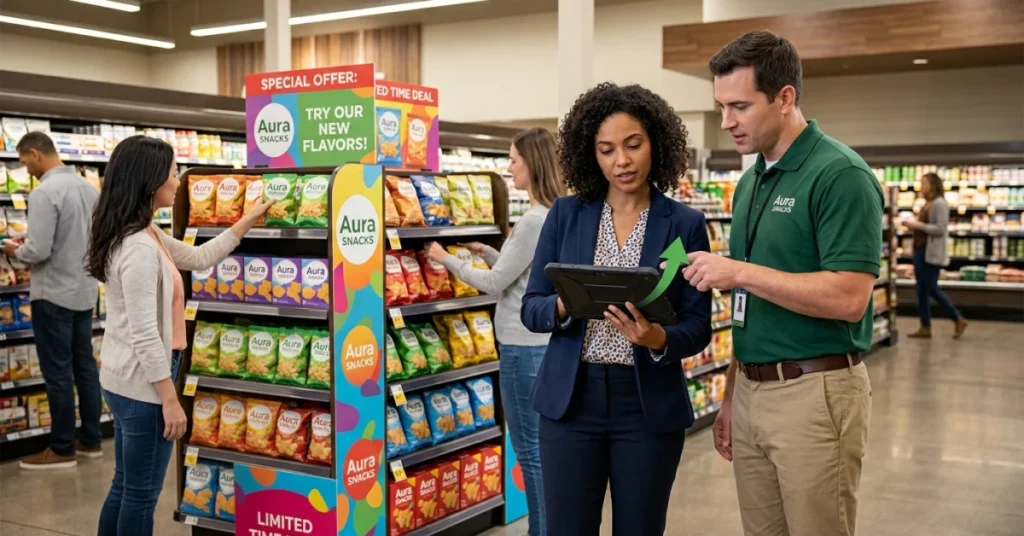
Understanding promotional display ROI is the first step toward knowing which outcome you actually got.
Trade Promotion Effectiveness vs. Promotion Performance
Promotion performance asks: did sales go up? Trade promotion effectiveness asks a harder question: did profit go up above what would have happened anyway?
Those two questions have very different answers. Over 70% of trade promotions fail to break even on incremental profit, according to Strategyand Pwc.
Brands keep running them anyway. The volume numbers look fine on a spreadsheet — so the real problem stays hidden.
Why Measuring Incremental Sales Matters
Incremental sales are the units sold only because the promotion ran — not the baseline you would have sold regardless. That gap is where real trade promotion ROI lives.
Softservebs found that CPG trade spend decisions made without an incremental baseline overstate returns by 30% or more. No dashboard fixes that — only a sharper definition does.
The real question isn’t whether you can track a promotion. It’s whether you’re tracking the right thing — and most teams aren’t.
That makes the how of measurement the most urgent problem to solve.
How Do You Measure Trade Promotion Effectiveness?
Stolen demand looks like a win — until you check the week after the promotion ends. Sales drop, and the lift was never real.
Most companies measure total sales volume during the promotion window. They ignore the incremental profit generated above what would have happened anyway.
That definition gap is why no dashboard fixes the underlying loss. Over 70% of trade promotions fail to break even (Acuvate), yet brands keep running them because the volume numbers look good on a slide.
Establishing a Baseline Before the Promotion
A baseline is the sales number you would have hit with no promotion at all. Without it, every sales spike looks like proof the promotion worked.
Build your baseline from at least 8–12 weeks of pre-promotion data, adjusted for seasonality. That single step separates real lift from noise.
Measuring Incremental Sales and Revenue Lift
Incremental lift is the difference between actual promoted sales and your baseline — nothing more. If your baseline predicted 1,000 units and you sold 1,200, your lift is 200 units, not 1,200.
Revenue lift only matters if margin holds. A deep discount that moves 500 extra units at a loss is not a win — it is a funded loss.
Calculating Trade Promotion ROI
Trade promotion ROI divides incremental gross profit by total trade spend. Ideas Repec finds that promotional price elasticity averages about 1.76 across CPG categories.
That means a 10% price cut lifts volume roughly 17.6%. It is rarely enough to offset the margin hit.
If your incremental gross profit is less than what you spent on the promotion, the ROI is negative. That is the number most trade promotion management teams never calculate.
Accounting for Promotion Costs and Trade Spend
CPG trade spend includes discounts, retailer fees, display costs, and logistics — not just the price reduction. Most brands undercount total cost by 20–30% because they only log the invoice discount.
Use promotional display ROI data to capture hidden execution costs at the store level. Every uncounted dollar makes your ROI look better than it is.
Comparing Promoted and Non-Promoted Sales
Run a control group — stores or regions that received no promotion — alongside your promoted set. The gap between the two groups is your cleanest measure of trade promotion effectiveness.
Without a control, you cannot separate your promotion’s impact from a market trend or a competitor’s price move. Acuvate notes that brands using control-group testing consistently find their true lift is 30–40% lower than their unadjusted numbers suggest.
📊 By the Numbers
Over 70% of trade promotions fail to break even when measured by true incremental profit.
Knowing how to calculate lift and ROI is only half the battle. The other half is knowing which specific numbers to track every single time.
Which Metrics Should You Track for Trade Promotion Effectiveness?
Fixing the definition gap means tracking metrics that measure incremental profit, not just activity. The six KPIs below separate promotions that genuinely grow your business from ones that only move boxes.
According to Anaplan, companies that track the right metrics recover up to 2–4% of net revenue each year. They do it by making smarter trade spend decisions.
Incremental Sales Lift
This is the only metric that answers the real question: how many units sold because of the promotion? You calculate it by subtracting your baseline sales from total promoted sales. Baseline means what you would have sold anyway.
Without this number, every promotion looks like a winner. Total volume always rises during a deal. Incremental lift shows whether that rise actually paid for itself.
Promotion ROI
Promotion ROI divides the incremental gross profit by the total cost of running the promotion. A positive number means the deal created value. A negative number means you paid retailers to eat your own margin.
Most CPG trade spend never gets this calculation applied to it. That is why so many promotions repeat year after year despite destroying profit.
Trade Spend as a Percentage of Sales
This ratio tells you how much of every revenue dollar goes back out the door to fund promotions. The industry average sits near 20% of gross sales for consumer packaged goods brands. Most leadership teams never see that number clearly.
Tracking this metric over time shows whether your trade promotion strategy is tightening or loosening. A rising ratio with flat incremental lift is a red flag.
Promotional Sales Volume
Promotional sales volume measures total units moved during the promotion window. It is a useful input — but a dangerous standalone metric because it rewards shipping, not selling.
Pair it with display execution data to see where volume really came from. Did shoppers genuinely demand it, or did retailers just stock up at your discounted price?
Promotion Conversion Rate
Conversion rate tracks how many shoppers who saw your promoted product actually bought it. A high display count with a low conversion rate means your price point or creative is not working.
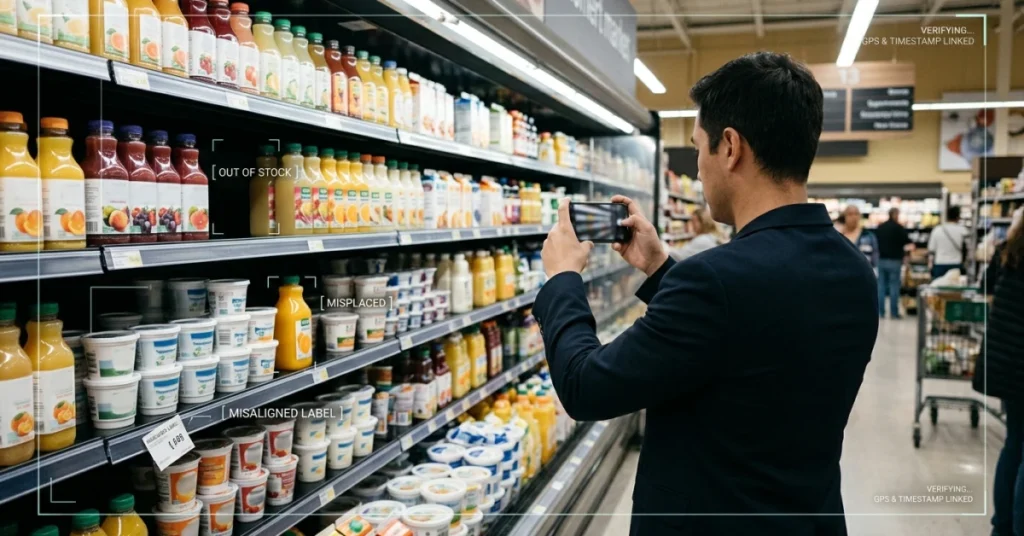
NielsenIQ research shows that in-store execution failures drive low conversion. Wrong placement and missing displays are leading culprits — even on well-funded promotions. Fix the shelf before you raise the budget.
Post-Promotion Sales Decline
This metric measures how sharply sales drop in the weeks after a promotion ends. A steep drop means shoppers stockpiled product. You borrowed future sales at a discount — you did not grow your base.
Strong trade promotion optimization targets a post-promotion dip of less than 15% below pre-promotion baseline. Anything deeper means the deal trained shoppers to wait for the next one.
📊 By the Numbers
CPG brands spend roughly 20% of gross revenue on trade promotions — yet most never calculate incremental ROI per event.
Knowing which metrics to track is only half the battle. The harder part is deciding what to do when the numbers confirm a promotion you already ran was a loss.
Conclusion
Most teams skip the hard part. They never separate promotions that grow profit from ones that just move boxes. Only 20% of trade promotions are profitable (according to Strategyand Pwc). That means the default approach loses money at scale.
The fix is not a better dashboard — it is a better definition. Measure incremental profit above your no-promotion baseline. When you do, trade promotion effectiveness stops being a guessing game.
Start by auditing one past promotion using incremental lift. That single step changes how you look at every decision that follows.