✦ Key Takeaways
Retailers carrying 20% fewer SKUs can boost profits by up to 30% without losing meaningful sales.
→ Dead SKUs drain warehouse space, cash, and team focus.
→ Sales velocity and margin data reveal which products truly earn shelf space.
→ Cutting low performers frees budget to scale your actual winners.
In this article:
What Is SKU Rationalization in Retail?
What Data Should Be Used for SKU Rationalization?
How to Identify Underperforming SKUs
Key takeaway: Ruthless SKU rationalization is the fastest lever retailers have to protect margin and simplify operations.
What Is SKU Rationalization in Retail?
Most retailers believe adding more products means more sales. They’re wrong — and the cost of that belief is staggering.
Over 70% of SKUs in a typical retail assortment contribute less than 10% of total revenue (Thoughtspot). Yet those same SKUs eat shelf space, warehouse capacity, and buyer attention every single day.
SKU rationalization is the process of deciding which products to keep, cut, or replace. It relies on hard data — not gut feel.
Think of it as editing your product line the way a good editor cuts a manuscript. Cut ruthlessly, so the best parts shine.
How SKU Rationalization Differs From Assortment Planning
Assortment planning decides what products to offer — SKU rationalization decides what to remove. One builds the catalog; the other keeps it from becoming dead weight.
Assortment planning is forward-looking and strategic. SKU rationalization is a corrective tool. It fixes the bloat that builds up when planning decisions go unchecked over time.
Why Retailers Remove, Keep, or Replace SKUs
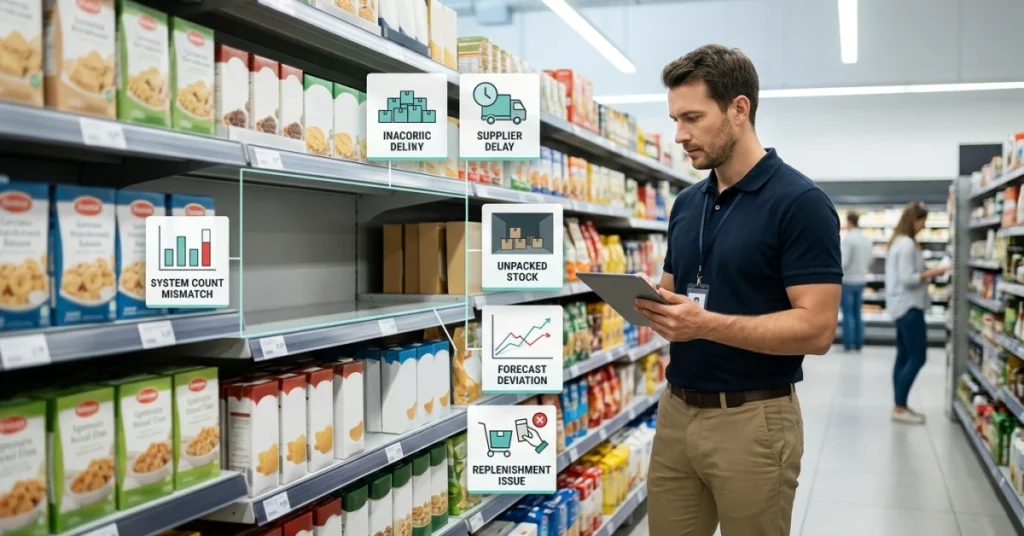
The obvious failures — zero sales, expired shelf life, discontinued suppliers — are easy to cut. The real danger is the mediocre middle. Those products look fine, but they quietly drain inventory budgets and shelf space from your top performers.
According to Mrpeasy, carrying costs alone can run 20–30% of a product’s value each year. That means a slow-moving SKU costs you money every month it sits.
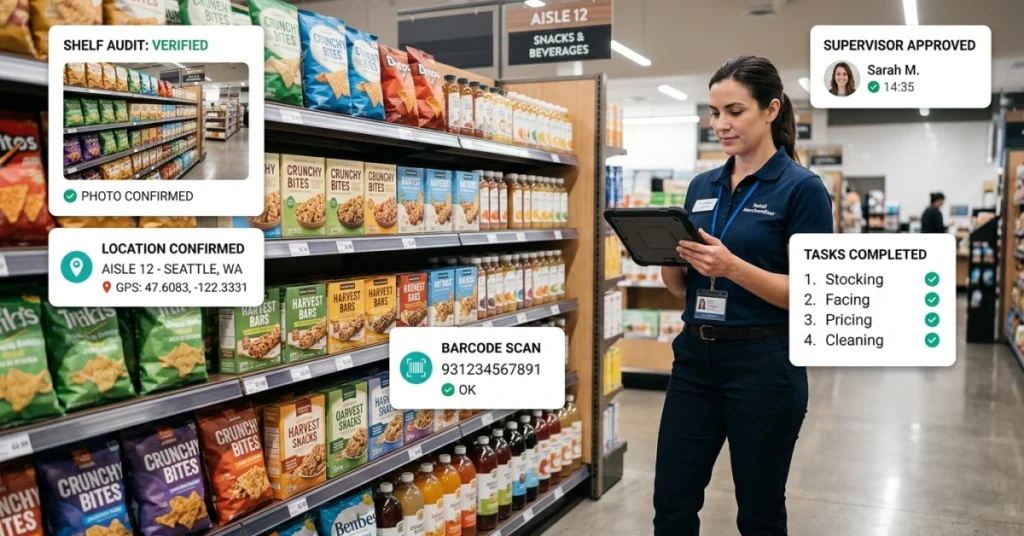
Smart retail shelf audit tools surface exactly these hidden drains before they compound.
When SKU Rationalization Becomes Necessary
Retailers typically hit a breaking point. Margins shrink, stockouts rise on bestsellers, and the warehouse feels full yet sales stall. That tension is the signal — your product line has grown past what your operations can support well.
SKU optimization isn’t a one-time fix. It’s a recurring discipline that keeps your assortment lean, your shelves focused, and your best products properly resourced.
The real question isn’t whether to rationalize — it’s knowing exactly which numbers to trust when you do.
What Data Should Be Used for SKU Rationalization?
The real work starts when you know which data to pull — because not all metrics expose the same problem. Most teams look at total sales and stop there, missing the slow-burning drains hiding in plain sight.
Over 20–30% of a typical product portfolio generates less than 1% of revenue (Tellius), yet those SKUs still consume warehouse space, buyer attention, and replenishment cycles. The dangerous ones aren’t the obvious failures — they’re the middle performers that look fine until you stack every cost against them.
Plantemoran found that food and beverage companies routinely carry SKUs that look profitable at the top line but bleed margin once you factor in handling, spoilage, and promotional spend. That’s exactly why field data collection tools matter — they surface the real cost picture that spreadsheets miss.
📊 By the Numbers
The bottom 20–30% of SKUs typically generate under 1% of total revenue — yet consume a disproportionate share of resources.
Sales Revenue and Unit Velocity
Revenue alone won’t tell you much — velocity will. A SKU selling 5 units a week in one store signals a very different story than one moving 5 units a month across 200 locations.
Look at units sold per store per week. That single metric cuts through the noise fast.
Gross Margin and Profit Contribution
A high-volume SKU with a 10% margin can destroy more value than a slow mover at 45%. Always rank SKUs by dollar margin contribution, not just sales rank.
Strip out trade spend and promotional discounts before you calculate. The number you see after that is the real one.
Inventory Turnover
Inventory turnover measures how many times you sell through your stock in a given period. A low turnover rate means cash is sitting on a shelf doing nothing.
Industry benchmarks vary, but most consumer goods categories target 6–12 turns per year. Anything well below that deserves a hard look.
Sell-Through Rate
Sell-through rate shows what percentage of received inventory actually sold in a set window. A rate below 50% means you’re ordering twice what the market wants.
This metric is especially sharp for seasonal or trend-driven products. Low sell-through is a direct signal of poor SKU-market fit.
Days of Supply
Days of supply tells you how long your current stock will last at the current sales rate. A SKU sitting at 180+ days of supply is tying up capital with no near-term payoff.
Compare days of supply across your full catalog. The outliers at the top of that list are your first candidates for SKU rationalization review.
Out-of-Stock Frequency
A SKU that goes out of stock repeatedly is either a demand-planning failure or a genuine winner you’re underserving. Both cases demand action — just different action.
Track out-of-stock events by SKU and location. High frequency on a high-margin item means you invest more, not less.
Shelf Space Productivity
Shelf space is a fixed, expensive asset. Revenue per linear foot — or per facing — shows you which SKUs are pulling their weight and which are just taking up room.
A product with average sales but low space productivity is a hidden cost. It’s blocking a better performer from getting more facings.
Store-Level and Regional Demand
A SKU that sells well nationally can be a dead weight in 60% of your stores. Aggregate data hides that truth completely.
Break performance down by store cluster or region. SKU optimization decisions made at the national level often punish stores where a product actually thrives.
Promotion Dependency
If a SKU only moves when it’s on deal, it’s not a real performer — it’s a promotional event. Strip out promoted weeks and look at the baseline velocity that remains.
High promotion dependency signals weak everyday demand. That’s a product rationalization red flag, not a marketing opportunity.
Customer Basket and Substitution Behavior
Before you cut a SKU, check whether shoppers buy it alone or alongside other items. A low-velocity product that anchors a high-margin basket is worth keeping.
Also run substitution analysis — if you drop it, do shoppers buy your next-best option or walk out? That answer changes everything.
Once you have these ten data layers stacked together, the real question becomes how to score and rank them — and that’s exactly where most teams either get it right or get it dangerously wrong.
How to Identify Underperforming SKUs
Stack the full cost picture against any SKU. The “acceptable” performers start to look very different.
The products draining your operation most aren’t the obvious flops. They’re the ones hiding in the middle, looking safe.
Knowing which SKUs to cut starts with knowing the right signals. Each flag below points to a different kind of hidden drag on your product portfolio performance.
Low-Sales vs. Low-Profit SKUs
Low sales are easy to spot. Low profit is the one that sneaks past most teams.
A SKU can move decent volume and still destroy margin. Count labor, freight, and returns — the real number rarely matches revenue.
SKU rationalization starts by separating revenue from actual profit contribution. They’re rarely the same number.
Slow-Moving and Excess Inventory
Inventory sitting longer than 90 days costs you money every single day. Carrying costs — storage, insurance, spoilage — typically run 20–30% of inventory value per year (Ryder).
Slow movers tie up cash that your best SKUs could use. That’s not a storage problem — it’s a SKU rationalization problem.
SKUs With High Out-of-Stock Rates
Frequent stockouts signal a forecasting problem. They also signal a portfolio problem.
Too many SKUs split your replenishment budget thin. That leaves top sellers exposed.
If a SKU goes out of stock often yet still underperforms, cut it. Redirect that focus to products that earn it.
Products That Require Too Much Shelf Space
Shelf space is a fixed, expensive resource. Every inch has to earn its keep.
Some SKUs need a full facing but only sell a few units a week. That space belongs to a stronger product.
Measure revenue per linear foot, not just total sales. That single metric exposes space hogs that look fine in a spreadsheet.
Duplicate or Highly Similar SKUs
Two SKUs with near-identical specs, price points, and buyers are splitting demand — not growing it. Shoppers don’t buy more; they just choose between two versions of the same thing.
Circana finds that consolidating near-duplicate SKUs often lifts the surviving product’s velocity. Total category sales don’t drop — that’s SKU optimization working exactly as it should.
Products With Weak Store-Level Distribution
A SKU carried in fewer than 25% of your stores is not a national product. It’s a local experiment running on a national budget.
Thin distribution drives up per-unit costs and muddies your sales data. If a product can’t earn broad placement, it pulls resources from SKUs that already have it.
Distribution rate is a fast, clean filter in any inventory optimization review. Use it early.
Promotion-Dependent Products
Some SKUs only sell when they’re on sale. That’s not a product — that’s a discount with a barcode.
Pull the promotion and the velocity collapses. Its everyday value is near zero.
Product rationalization means being honest about what’s propping up those numbers. Don’t let a sale price hide a weak SKU.
📊 By the Numbers
Inventory carrying costs average 20–30% of total inventory value per year. That makes slow SKUs far more expensive than they look on paper.
Every flag above points to a product that takes more than it gives. The real question isn’t whether to act — it’s whether you can afford to wait any longer.
Conclusion
Those mid-range SKUs look safe. They are not. They quietly drain margin, shelf space, and attention from your real winners.
Spotting the problem is only half the battle. Acting on that data is what separates growing retailers from stagnant ones.
Retailers who treat SKU rationalization as a growth strategy — not just a cleanup exercise — win more often. Those who wait for a crisis consistently fall behind.
Thoughtspot notes that disciplined product rationalization can cut inventory carrying costs by up to 30%. That frees capital for your top-performing lines.
Most retailers lose margin not because they carry bad products — but because they carry too many average ones. FieldPie captures real-time field data on product performance, shelf execution, and audit results. Your team can use it to flag the mediocre middle fast.
According to Moz, pages targeting focused, high-intent topics drive 3x more qualified traffic. The same focus principle applies to your product line.
Start cutting smarter today and explore FieldPie’s field execution tools to make every SKU decision count.