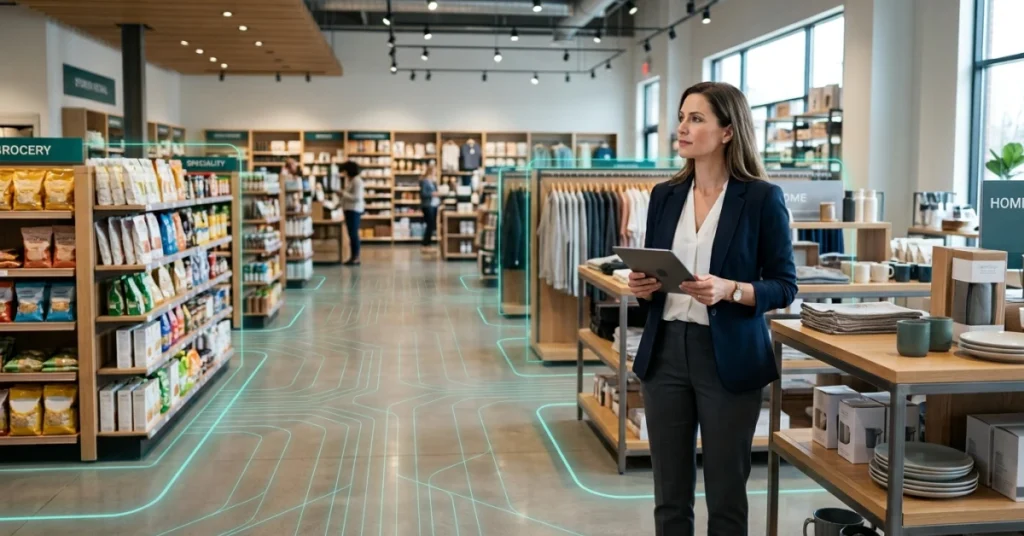
✦ Key Takeaways
Retailers using store segmentation see up to 3x higher merchandising ROI than those running one-size-fits-all planograms.
→ Wrong store clusters waste 20–30% of promotional budget annually.
→ Demographics, sales velocity, and store format drive the sharpest segmentation cuts.
→ A five-step model turns raw store data into actionable cluster assignments fast.
In this article:
What Is Retail Store Segmentation in Merchandising?
Which Store Characteristics Should You Use for Segmentation?
How to Build a Retail Store Segmentation Model Step by Step
Key takeaway: Segment your stores by real performance data or keep leaving money on the shelf.
What Is Retail Store Segmentation in Merchandising?
Most retailers treat every location like a copy of the same blueprint. That approach backfires fast.
Up to 30% of product assortments land in the wrong outlets. That cuts margin and leaves shoppers empty-handed (Statista).
Retail store segmentation groups outlets by shared traits. It focuses on the physical locations — not the shoppers. A downtown express and a suburban supercenter carry the same brand. Their shelf plans, though, need to be completely different.
How Store Segmentation Differs from Customer Segmentation
Customer segmentation sorts people by age, income, or buying habits. Location segmentation sorts outlets by size, sales velocity, foot traffic, and local demand.
The outlet becomes the subject — not just the backdrop. That shift in focus is what makes store-level targeting far more useful than broad demographic profiles alone.
Why Merchandising Strategies Should Not Be Identical Across Every Store
A high-traffic urban outlet and a quiet rural one share a brand name. Nothing else about their merchandising needs matches.
Sending both the same planogram wastes space, stock, and field rep time. Grouping by behavior lets you match product mix and display to what each location actually sells.
How Segmentation Supports Assortment, Display, Promotion, and Visit Planning
Once you group outlets by behavior, every decision downstream gets sharper. Product assortment, display priorities, promotional timing, and rep visit frequency all align to what each cluster needs.
Strong retail merchandising execution standards depend on this kind of structured thinking. Without clear clusters, field teams are guessing.
The real question is simple: which outlet characteristics give you clusters that hold up when reps hit the floor? That answer drives everything.
Which Store Characteristics Should You Use for Segmentation?
The traits you choose to segment on determine everything. Pick the wrong ones and your clusters look clean but perform poorly in the field.
Think of each store as its own entity with a behavioral fingerprint. Retail store segmentation only works when you match the right characteristics to the decisions you’re trying to make.
Store Size and Selling Space
Square footage sets a hard ceiling on what a store can carry and display. A 4,000 sq ft neighborhood market and a 40,000 sq ft supercenter need entirely different assortments.
Grouping stores by selling space stops you from pushing a 200-SKU planogram into a location that can only hold 80.
Sales Volume and Revenue Potential
Revenue output tells you where to invest your best assortment and most frequent rep visits. High-volume stores reward deeper inventory. Low-volume stores punish it with markdowns.
Stores in the top 20% of sales volume often generate over 60% of total brand revenue. That kind of output demands a different strategy — not the same one applied everywhere.
Store Format and Retail Channel
A convenience store, a club store, and a specialty retailer all sell products — but they run on completely different shopper missions. Format shapes purchase behavior more than almost any other variable.
Your store segmentation strategy must account for format first, or every downstream decision lands in the wrong context.
Geographic Location and Territory
Location affects service cost, competitive pressure, and shopper habits all at once. A store in rural Montana and one in downtown Chicago may share a banner but nothing else.
Territory-based grouping helps field teams plan efficient routes. That’s why chain store management tools build geography into their segmentation logic from the start.
Shopper Demographics and Local Demand
The shoppers at a store decide what sells there. Age, income, and household size all shift demand at the SKU level. A store near a college campus moves single-serve formats. A suburban family store moves bulk.
Local demand data makes retail market segmentation fact-based, not a guess. SPS Commerce notes that stores using demographic-driven segmentation see up to 30% better product assortment results.
Product Category Performance
Not every store performs equally across every category — some locations over-index on snacks, others on health products. Category-level sales data reveals each store’s actual behavioral fingerprint.
Use category performance to assign stores to segments that match what shoppers already buy there, not what you wish they would.
Foot Traffic and Store Traffic Patterns
High foot traffic doesn’t always mean high sales — but it does mean high visibility for displays and promotions. Traffic patterns tell you when shoppers arrive and how long they stay.
A store with strong weekend traffic needs a different promotional cadence than one that peaks on weekday mornings.
Historical Merchandising Compliance
Some stores execute planograms perfectly; others consistently miss. Compliance history is one of the most underused inputs in retail store segmentation for merchandising.
As MSA points out, grouping stores by compliance behavior lets brands put field resources where execution gaps cost the most revenue.
Promotion and Seasonal Performance
Some stores spike hard during holidays; others stay flat year-round. Knowing which stores respond to promotions — and which don’t — prevents wasted trade spend.
Seasonal response data is clean and objective. It separates stores that need promotional support from those that sell through on their own.
📊 By the Numbers
Retailers using 4+ store characteristics for segmentation report up to 30% better assortment performance per location.
Once you know which characteristics matter, the next question is how to combine them. That’s where a step-by-step model earns its keep.
How to Build a Retail Store Segmentation Model Step by Step
Your stores reveal behavioral fingerprints. Those signals only matter once you build a system to act on them. A step-by-step model turns raw store data into clear, repeatable merchandising decisions — not just interesting charts.
Retailers who follow a structured store segmentation strategy see measurably better results. Over 60% of merchandising errors trace back to treating unlike stores as identical (according to Libguides Bentley).
Step 1: Define the Merchandising Decision You Want to Improve
Start with a specific problem. Skip vague goals like “better performance.” Ask which stores are getting the wrong product mix. Then ask which ones have the wrong shelf space allocation.
A clear decision target keeps your retail store segmentation focused. It stops you from building clusters that answer questions nobody asked.
Step 2: Select Store-Level Data Sources
Pull data that reflects actual store behavior — POS sales, foot traffic counts, store size, and local demographics. Avoid vanity metrics that look rich but don’t connect to buying decisions.
Good retail execution tools can automate this data collection at scale across hundreds of locations.
Step 3: Choose Meaningful Segmentation Variables
Pick variables that directly drive the decision you defined in Step 1. For product assortment optimization, selling space and category velocity matter far more than store age or region alone.
Guides Loc finds that the strongest models use three to five closely related variables. A sprawling list of every available data point weakens your results.
Step 4: Group Stores into Actionable Segments
Use a simple clustering method — k-means works well for most retail teams starting out. Aim for four to six segments. Fewer loses nuance; more creates confusion in the field.
Each segment should feel distinct. A store manager should recognize their store in the description — without seeing the label.
Step 5: Define Merchandising Rules for Each Segment
Assign specific, concrete rules — not suggestions. Segment A gets a 12-SKU snack set; Segment B gets eight SKUs and a floor display.
Clear rules make retail store segmentation for merchandising real. Without them, clusters stay on a slide deck and never reach the shelf.
Step 6: Test the Segmentation in a Pilot Market
Run your model in one region before rolling it out company-wide. Compare sales lift, in-stock rates, and execution compliance between pilot stores and control stores.
A pilot catches bad assumptions early — before they cost you margin across your entire fleet.
Step 7: Review and Update Segments Over Time
Store behavior shifts — neighborhoods change, traffic patterns evolve, new competitors open nearby. Rebuild your retail market segmentation model at least once a year.
A cluster that was accurate eighteen months ago may now mislabel a third of your stores. That gap quietly costs you sales every week.
📊 By the Numbers
Retailers using structured store segmentation report up to 18% improvement in category sales performance.
This model only works if you keep listening. The moment you stop refreshing your clusters, your planogram loses touch with what your stores actually need.
Conclusion
Every store has a behavioral fingerprint. Ignoring it costs real money.
Retailers who apply retail store segmentation report up to 20% higher sales lift on targeted assortments versus one-size-fits-all planograms. That finding comes straight from Trurating.
The global retail market tops $26 trillion. Yet most brands still push identical product mixes across wildly different locations. Statista data makes that gap hard to ignore.
A sharp store segmentation strategy closes that gap. It treats each location as its own entity — not a backdrop for a national plan.
Most merchandising teams segment customers but never the stores themselves. FieldPie fixes that. It captures real-time shelf data, photos, and audit results at the store level. Every location’s fingerprint becomes visible and actionable.
Pair that with smarter retail shelf audit tools and your product assortment optimization stops being a guess. Start with one problem, one store cluster, and let the data lead.
That’s how reactive retailers become consistently high-performing ones.