


In today’s increasingly competitive retail environment, a brand’s shelf presence is not merely a logistical consideration — it is a critical driver of revenue, market positioning, and long-term commercial success. Share of shelf (SOS) has emerged as an indispensable performance metric for brands committed to sustained growth and retail excellence.
Defining Share of Shelf
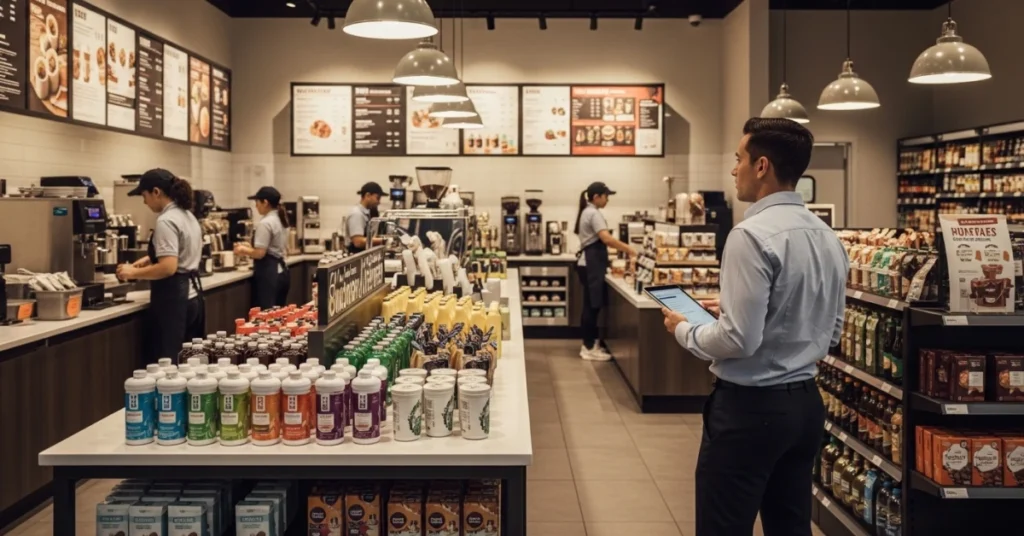
Share of shelf quantifies the proportion of shelf space a product or brand occupies within a given category at the point of sale. It serves as a direct measure of physical presence and visual prominence at the moment purchasing decisions are made — going beyond simple product availability to assess competitive standing on the retail floor.
While the metric is often reduced to linear feet or number of facings, its full strategic value encompasses premium placement (e.g., eye-level positioning, end-cap displays), brand blocking, and the overall quality of product presentation. For operations managers and field service directors, a thorough understanding of SOS is essential to ensuring that field team efforts translate into measurable market advantage.
Share of Shelf vs. Market Share: A Critical Distinction
These two metrics are frequently conflated, yet they measure fundamentally different aspects of brand performance:
- Share of Shelf is an input metric — it reflects a brand’s physical visibility and potential consumer exposure within a retail environment.
- Market Share is an output metric — it captures actual sales volume or revenue as a percentage of total category sales, reflecting realized consumer behavior.
A strong SOS does not guarantee market share, but it significantly influences it. Brands that optimize their shelf presence are substantially better positioned to convert visibility into sales.
The Strategic Value of Share of Shelf
Revenue Impact
The relationship between shelf presence and sales performance is well established. Products that are prominently displayed, consistently stocked, and strategically placed benefit from heightened discoverability and reduced out-of-stock incidents — both of which have a direct and measurable effect on revenue.
Competitive Intelligence
Monitoring competitors’ shelf allocations provides actionable insight into their merchandising strategies, promotional cadence, and new product activity. This intelligence enables brands to anticipate market shifts, identify emerging gaps, and respond with precision.
Retailer Relationship Management
Data-driven SOS insights strengthen a brand’s negotiating position with retail partners. Demonstrating that optimized shelf presence drives category growth and profitability provides a compelling basis for securing more favorable placements, expanded assortments, and stronger long-term agreements.
Marketing and Merchandising Optimization
SOS data validates the in-store effectiveness of promotional campaigns, supports planogram refinement, and ensures product assortments are aligned with both consumer demand and retail realities — reducing guesswork and improving return on investment.
Measuring Share of Shelf: From Manual Audits to AI-Driven Intelligence
Limitations of Traditional Measurement
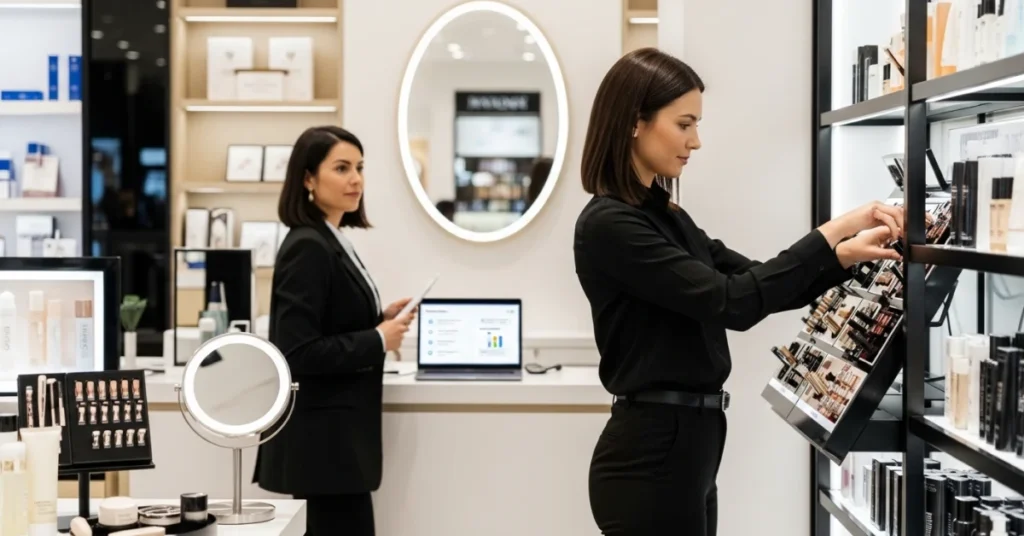
Conventional SOS measurement relies on field teams conducting manual store audits — counting facings, measuring shelf lengths, and documenting placements by hand. While this approach offers firsthand observation, it is characterized by significant operational constraints:
- High labor intensity — extensive time and resource requirements per store visit
- Inconsistency and subjectivity — variability in data collection and interpretation
- Limited scalability — difficult to execute comprehensively across large retail networks
- Delayed insights — data processing timelines measured in weeks, not hours
The Modern Standard: AI and Image Recognition
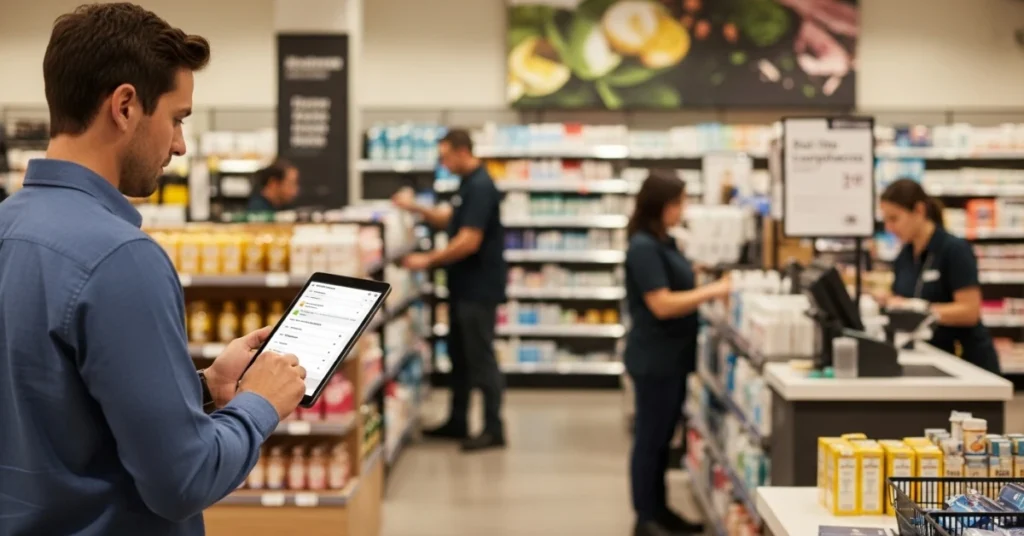
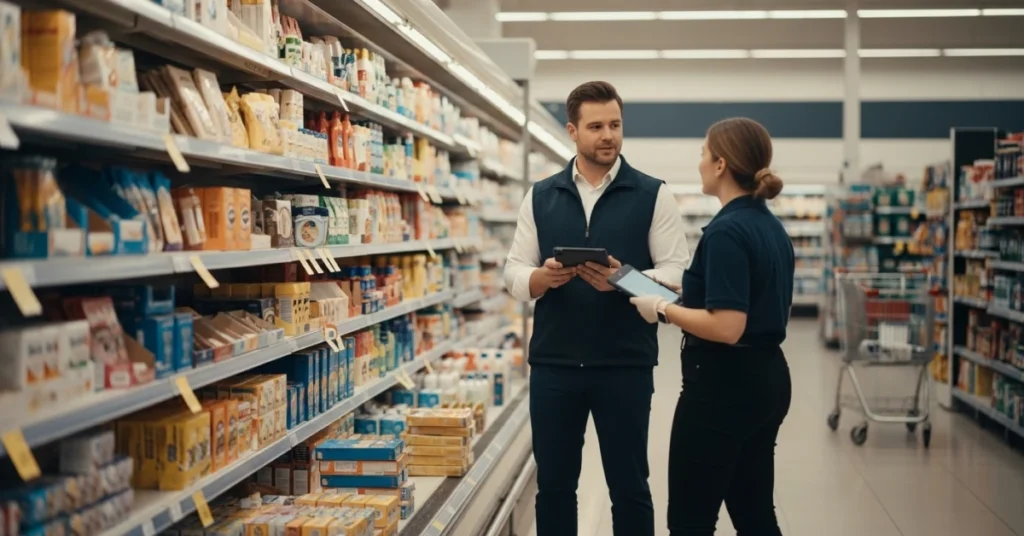
Advances in artificial intelligence and image recognition have fundamentally transformed SOS measurement. Field teams now capture shelf imagery via mobile devices, and AI algorithms instantly analyze these images to identify products, count facings, measure space allocation, and assess planogram compliance. The operational benefits are substantial:
- Accuracy — objective, consistent data free from human interpretation bias
- Speed — real-time insights enabling immediate corrective action
- Scalability — efficient execution across thousands of locations
- Cost efficiency — significant reduction in manual processing and operational overhead
| Feature | Traditional Manual Audit | AI-Enabled (e.g., FieldPie) |
|---|---|---|
| Data Collection | Manual counts, handwritten notes | Photo capture, automated analysis |
| Accuracy | Subjective, error-prone | Objective, consistent |
| Speed of Insights | Weeks to months | Real-time or near real-time |
| Scalability | Limited, cost-prohibitive at scale | High-volume, multi-location capable |
| Cost Efficiency | High labor and travel costs | Lower operational costs, higher ROI |
Key Metrics for SOS Calculation
A comprehensive SOS framework should capture the following data points:
- Linear Feet/Inches — total physical shelf length occupied
- Number of Facings — visible product units presented side-by-side
- Shelf Position — placement relative to eye-level and other high-value zones
- Assortment Compliance — presence of all contracted or agreed-upon SKUs
- Promotional Display Count — quantity and quality of secondary display placements
- Out-of-Stock (OOS) Rate — frequency and duration of vacant shelf slots
Translating SOS Data into Commercial Outcomes
Data collection is the foundation; strategic application is where competitive advantage is built.
Planogram Optimization
Precise SOS data enables brands to refine planograms with confidence, ensuring products are positioned to maximize consumer engagement. Digital tools facilitate rapid distribution of updated planogram instructions to field teams, driving compliance and accelerating in-store execution.
Proactive Competitive Response
Continuous SOS monitoring against competitors allows for swift, informed decision-making. When a competitor gains significant shelf space in a key market, brands can analyze the situation promptly and deploy resources strategically to protect or expand their own position.
Growth Opportunity Identification
SOS analysis reveals markets or store clusters where a brand is underrepresented, highlighting untapped growth potential. It also surfaces underperforming SKUs — products with adequate shelf presence but weak sales conversion — prompting targeted reviews of pricing, promotions, or product positioning.
Promotional Compliance Verification
Promotions deliver value only when executed correctly at the store level. Real-time SOS monitoring, combined with digital inspection capabilities, enables brands to confirm that displays are correctly installed, promotional materials are in place, and inventory levels support the campaign — ensuring that marketing investment translates into measurable in-store impact.
Achieving retail dominance through disciplined share of shelf management is not aspirational — it is an operationally executable objective when supported by the right data infrastructure, field execution capabilities, and strategic leadership.
Conclusion
Share of shelf is not a passive metric — it is an active lever for revenue growth, competitive positioning, and retail execution excellence. Brands that treat SOS as a strategic priority, backed by real-time data and disciplined field operations, consistently outperform those that rely on intuition alone.
Ready to take control of your shelf presence?
See how FieldPie helps your field teams capture, analyze, and act on share of shelf data — in real time, at scale.


