


OSA KPI (On-Shelf Availability Key Performance Indicator) measures the percentage of products from a defined assortment matrix that are physically present and purchasable on a retail shelf at any given moment. It ranges from 0% to 100% and directly quantifies lost sales risk at the point of purchase.
What Is OSA KPI and Why Does It Matter in Retail?
On-shelf availability is one of the most consequential metrics in consumer goods retail. When a shopper reaches for a product and the shelf is empty, that sale is lost — and in most cases, so is the customer. Research published by ParallelDots confirms that out-of-stock events cost the global retail industry an estimated 8–10% of total sales annually.
The osa kpi captures this exposure with precision. Unlike broad inventory metrics that measure stock somewhere in the supply chain, OSA measures stock exactly where it must be: visible and reachable on the store shelf. A product sitting in a back-room stockroom does not count toward your OSA score.
For CPG brands and retailers alike, OSA is not a vanity metric. It is a direct proxy for revenue health, brand equity, and shopper satisfaction.
How Is OSA Different from In-Stock Rate?
Many teams conflate OSA with in-stock rate, but the distinction is critical:
| Metric | What It Measures | Where Stock Must Be |
|---|---|---|
| In-Stock Rate | Product exists somewhere in the store | Warehouse, back room, or shelf |
| OSA KPI | Product is on the shelf, facing out | Shelf only — visible to the shopper |
| Shelf Availability | Physical presence on the shelf face | Shelf, correctly positioned |
A store can show 99% in-stock rate and still suffer a 15% OSA gap if replenishment workflows are slow or shelf availability is not actively managed.
How Is OSA KPI Calculated?
The standard formula for on-shelf availability is straightforward:
OSA (%) = (Number of SKUs present on shelf ÷ Total SKUs in assortment matrix) × 100
As documented by Inspector Cloud, the assortment matrix — the list of products contractually required to be on the shelf — is the baseline denominator. If your matrix contains 40 SKUs and 36 are present on the shelf during an audit, your OSA score is 90%.
What Counts as “Present” on the Shelf?
The calculation becomes nuanced when interchangeable goods are factored in. Inspector Cloud’s methodology notes that a group of interchangeable SKUs can be treated as a single matrix slot — meaning if Product A is out of stock but Product B (its approved substitute) is present, the slot counts as filled and OSA remains at 100% for that position.
Key variables that affect your calculation:
- Audit timing: OSA fluctuates throughout the day; morning audits typically show higher scores than post-peak-hour checks.
- Store segmentation: A single chain-wide OSA figure masks store-level gaps. Always calculate OSA per store, per category, and per channel.
- Image capture method: Manual store audits, mobile image recognition, and computer vision platforms each produce different data granularity and accuracy.

What Causes Low OSA Scores? The 6 Root Causes
Understanding why shelf availability drops is the foundation of any corrective action. The most common root causes fall into six categories:
- Replenishment failures — Stock exists in the back room but has not been moved to the shelf on schedule.
- Phantom inventory — The system shows stock as available, but it is physically missing, misplaced, or damaged.
- Order management errors — Incorrect order quantities or missed order windows leave gaps before the next delivery cycle.
- Planogram non-compliance — Products are placed in the wrong shelf location, making them invisible to shoppers and audit systems.
- Supplier delivery shortfalls — Upstream supply chain disruptions reduce the volume delivered to the store.
- Shrinkage and misplacement — Theft, damage, or staff misplacement removes product from its designated shelf position.
According to POS Potential’s OSA analysis, replenishment failures and phantom inventory together account for more than 70% of out-of-stock events at the store level — making in-store execution the primary lever, not supply chain logistics.
Understanding your field team’s daily execution patterns is essential here. Teams that use a structured retail execution platform can flag replenishment delays in real time before they become shelf gaps.
Key OSA KPIs You Should Track (Detailed Guide)
OSA is not a single KPI. It is part of a broader retail execution KPI framework
To truly understand performance, you need to analyze these KPIs together, not in isolation.
1. On-Shelf Availability Rate (OSA %)
What it measures
The percentage of products physically available on the shelf and ready for purchase
📊 Formula
OSA (%) = (Number of SKUs available on shelf ÷ Total SKUs) × 100
🎯 How to interpret
- 97–99% → excellent
- 90–95% → at risk
- <90% → critical issue
💡 Key insight
👉 OSA is a result metric, not a root cause
2. Stockout Rate
What it measures
The percentage of products missing from the shelf
📊 Formula
Stockout Rate = 1 – OSA
🎯 How to interpret
- 2–5% → normal
- 5–10% → requires action
- 10% → serious revenue risk
💡 Key insight
👉 This reflects the customer experience directly
3. Share of Shelf (SOS)
What it measures
Your brand’s visibility on the shelf compared to competitors
📊 Formula
SOS = Your product facings ÷ Total facings
🎯 How to interpret
- High OSA + low SOS → products are available but not visible
- High SOS + low OSA → strong placement but poor availability
💡 Key insight
👉 OSA = availability
👉 SOS = visibility
👉 You need both to drive sales
4. Phantom Inventory Rate
What it measures
When the system shows stock, but the shelf is empty
📊 Simplified logic
Phantom Inventory = System stock – Actual shelf stock
🎯 How to interpret
- 0–2% → healthy
- 5%+ → serious operational issue
💡 Key insight
👉 One of the biggest hidden drivers of OSA problems
👉 Often accounts for 40–60% of stockouts
5. Planogram Compliance
What it measures
Whether products are placed correctly according to planogram rules
📊 Measured by
- Correct SKU
- Correct position
- Correct number of facings
🎯 How to interpret
- 95% → strong execution
- <90% → performance risk
💡 Key insight
👉 A misplaced product = functionally out of stock
6. Replenishment Time
What it measures
How long it takes to restock a shelf after it becomes empty
📊 Formula
Replenishment Time = Time between shelf empty → shelf refilled
🎯 How to interpret
- <2 hours → strong
- 2–6 hours → moderate
- 6 hours → poor
💡 Key insight
👉 Slow replenishment is one of the main causes of low OSA
7. Lost Sales Due to Stockouts
What it measures
Revenue lost when products are unavailable
📊 Basic calculation
Lost Sales = Average sales velocity × stockout duration
🎯 How to interpret
👉 This is the most important business KPI
👉 It translates OSA gaps into financial impact
💡 Key insight
👉 A 5% drop in OSA can result in millions in lost revenue
The Most Important Insight
These KPIs should never be analyzed separately.
👉 The real value comes from reading them together
🎯 Example Scenarios
Scenario 1
- Low OSA
- High replenishment time
👉 Root cause: in-store execution issue
Scenario 2
- Low OSA
- High phantom inventory
👉 Root cause: inventory accuracy problem
Scenario 3
- High OSA
- Low share of shelf
👉 Root cause: merchandising issue
Final Takeaway
👉 OSA alone does not tell the full story
👉 This KPI set gives you full operational visibility
Minimum KPI Dashboard Should Include:
- OSA %
- Stockout Rate
- Share of Shelf
- Phantom Inventory
- Replenishment Time
- Lost Sales
What Is a Good OSA KPI Benchmark?
Industry benchmarks vary by channel and category, but the following standards are widely referenced:
| Channel / Category | Target OSA (%) | Acceptable Floor (%) |
|---|---|---|
| Grocery — Top 20 SKUs | 97–99% | 95% |
| Grocery — Long Tail SKUs | 92–95% | 88% |
| Drug / Pharmacy | 95–98% | 92% |
| Convenience / C-Store | 90–94% | 87% |
| Mass Merchandise | 94–97% | 91% |
Any OSA reading below 90% across a category warrants immediate root-cause analysis. A sustained OSA below 85% typically signals a systemic failure — either in order management, shelf replenishment protocols, or both.
How to Measure OSA KPI: 4 Methods Compared
1. Manual Store Audits
Field reps physically count SKUs against the assortment matrix during scheduled store visits. This method is low-cost but slow, subjective, and limited in frequency. Data is typically 24–72 hours stale by the time it reaches a dashboard.
2. Mobile Image Recognition
Reps capture shelf image data using a smartphone app. An AI model processes the image and maps detected products against the planogram and assortment matrix. This approach dramatically improves audit speed and consistency. Platforms like GLAIR Vision’s OSA analysis engine use computer vision APIs to automate SKU detection and generate real-time shelf availability scores from a single image capture.
3. Point-of-Sale (POS) Data Analysis
Sales velocity data is used as a proxy: if a product’s sales drop to zero across a time window, it is flagged as a likely out-of-stock. This method is passive and scalable but lags real-world conditions and cannot distinguish between zero demand and zero availability.
4. IoT Shelf Sensors
Weight-based or RFID shelf sensors continuously monitor product presence. This method delivers the highest data frequency but carries substantial infrastructure cost and is currently viable mainly for high-value or high-velocity SKUs.
For most CPG brands operating across hundreds of stores, a combination of mobile image recognition and POS data analysis delivers the best balance of accuracy, cost, and operational scalability. Brands that want to deepen their analysis can explore how image recognition integrates with store audit workflows to reduce manual effort while improving data quality.
OSA KPI Improvement: Step-by-Step Checklist
Use this checklist to systematically close your OSA gap across every store in your network.
Phase 1: Diagnose
- Pull store-level OSA data for the past 30 days, segmented by category and SKU tier
- Identify stores with OSA below your acceptable floor threshold
- Cross-reference OSA gaps with POS sales data to confirm lost sales impact
- Categorize root causes: replenishment failure, phantom inventory, planogram non-compliance, or supplier shortfall
- Map the gap frequency by day of week and time of day to detect patterns
Phase 2: Fix In-Store Execution
- Establish a daily shelf check protocol for your top 20 SKUs in each store
- Set a maximum replenishment cycle time (recommended: 4 hours from back-room to shelf)
- Train store associates on planogram compliance and correct shelf-facing procedures
- Implement a real-time alert when any top-tier SKU drops to zero on the shelf
- Conduct a phantom inventory audit: reconcile system stock counts against physical counts
Phase 3: Fix Order Management
- Review order frequency and minimum order quantities for high-velocity SKUs
- Adjust safety stock levels based on actual shelf availability fluctuations, not just sales forecasts
- Establish supplier SLAs with delivery accuracy requirements tied to OSA targets
- Automate reorder triggers based on shelf-level data, not just warehouse inventory levels
Phase 4: Monitor and Sustain
- Set weekly OSA review cadences with store managers and field teams
- Build an OSA dashboard that shows store-level, category-level, and SKU-level scores in a single view
- Benchmark your OSA scores against channel averages quarterly
- Tie field team performance reviews to OSA improvement targets
How Technology Solves the OSA KPI Challenge
Manual processes cannot scale to the demands of modern retail execution. A brand operating in 2,000 stores cannot rely on weekly paper-based audits to protect shelf availability. The gap between audit frequency and real-world shelf conditions is where revenue leaks.
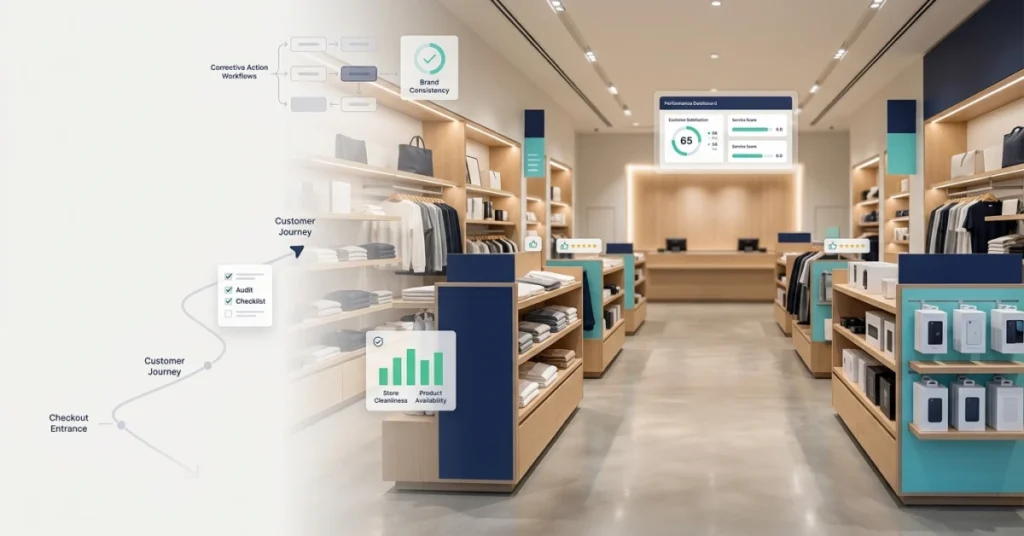
This is where platforms like FieldPie deliver measurable impact. FieldPie’s field execution software enables sales reps and merchandisers to conduct image-based shelf audits directly from their mobile devices. The platform captures shelf image data in the store, automatically compares it against the assortment matrix, and flags OSA gaps in real time — before the rep leaves the store.
Key capabilities that directly address OSA KPI challenges:
- Automated shelf image analysis: Reps capture a single image of a shelf section; the platform identifies each SKU, checks it against the planogram, and calculates OSA on the spot.
- Real-time task alerts: When a shelf gap is detected, the rep receives an immediate task to replenish or escalate.
- Store-level OSA dashboards: Managers see live OSA scores across their entire territory, not just post-visit reports.
- Root cause tagging: Reps tag each out-of-stock with a root cause (back-room stock available, supplier shortfall, etc.), building a structured data set for systemic analysis.
- Order management integration: When back-room stock is confirmed empty, FieldPie can trigger a replenishment order directly within the same workflow.
Brands using structured field team management tools consistently report OSA improvements of 5–12 percentage points within the first 90 days of deployment — a direct translation into recovered revenue.
For teams managing promotions alongside shelf execution, integrating promotional compliance tracking into the same platform eliminates the need for separate audit workflows.
OSA KPI in Context: How It Connects to Other Retail KPIs
OSA does not operate in isolation. Its performance is interlinked with several adjacent metrics that together define retail execution health:
| KPI | Relationship to OSA |
|---|---|
| Share of Shelf (SOS) | Measures your brand’s physical presence relative to competitors; low OSA reduces your effective SOS |
| Planogram Compliance | Non-compliance is a direct driver of OSA failures; products in wrong positions are functionally unavailable |
| Order Fill Rate | Supplier fill rate below 95% creates structural OSA gaps regardless of in-store execution quality |
| Inventory Turnover | High turnover SKUs are most vulnerable to OSA failures; require tighter replenishment cycles |
| Customer Service Level | OSA is the shelf-level expression of your overall service level to the end consumer |
Tracking these metrics together in a single retail KPI dashboard gives category managers a complete picture of execution performance rather than a siloed view of any single metric.
Common OSA KPI Mistakes to Avoid
Even experienced retail teams make these errors when managing on-shelf availability:
- Averaging across stores: A chain-wide OSA of 95% can mask a cluster of stores running at 80%. Always analyze at the store level.
- Measuring too infrequently: Weekly audits miss intraday and mid-week shelf gaps. High-velocity SKUs need daily or continuous monitoring.
- Ignoring root cause data: Knowing your OSA score is 88% is not actionable. Knowing that 60% of those gaps are replenishment failures from the back room is.
- Treating all SKUs equally: Your top 20% of SKUs by volume drive 80% of your revenue. Prioritize OSA protection for your A-tier products first.
- Not closing the loop on order management: Fixing in-store replenishment without addressing the upstream order cycle creates recurring gaps on the same SKUs.
Field teams that use mobile data collection during store visits avoid most of these pitfalls by capturing structured, timestamped evidence that feeds directly into root cause analysis.

Frequently Asked Questions (FAQ)
What is a good OSA KPI score for FMCG brands?
For top-tier FMCG SKUs in grocery channels, the industry target is 97–99% OSA. An acceptable floor is generally 95%. Scores below 90% indicate a systemic execution problem and require immediate root-cause analysis at the store level.
How often should OSA KPI be measured?
For high-velocity SKUs, OSA should be measured daily — ideally at multiple points throughout the day using mobile image capture or IoT sensors. For long-tail SKUs, a minimum of three audits per week per store is recommended. Weekly audits are insufficient for any product generating significant daily sales volume.
What is the difference between OSA KPI and shelf availability?
The terms are often used interchangeably, but there is a technical distinction. Shelf availability describes the physical state — whether a product is present on the shelf. OSA KPI is the formalized, quantified measurement of that state expressed as a percentage against a defined assortment matrix. OSA is shelf availability turned into a trackable, benchmarkable business metric.
Conclusion
OSA KPI is the most direct measure of whether your retail execution strategy is working where it counts: at the shelf, in front of the shopper. A strong OSA score protects revenue, preserves brand equity, and validates the investment you make in distribution and trade marketing.
Closing OSA gaps requires a disciplined combination of root-cause analysis, in-store execution protocols, order management discipline, and technology that gives your field teams real-time visibility. Brands that treat OSA as a live operational metric — not a periodic audit score — consistently outperform those that do not.
If your team is ready to move from reactive OSA reporting to proactive shelf execution, FieldPie gives you the tools to make that shift today.


