


Planogram optimization is the data-driven process of strategically arranging products on retail shelves to maximize sales per square foot, improve shopper experience, and reduce out-of-stocks. It combines sales data, shopper behavior research, space elasticity principles, and increasingly, ai-powered analytics to determine the ideal number of facings, product placement, and fixture layout for every shelf in a store.
What Is Planogram Optimization and Why Does It Matter in 2026?
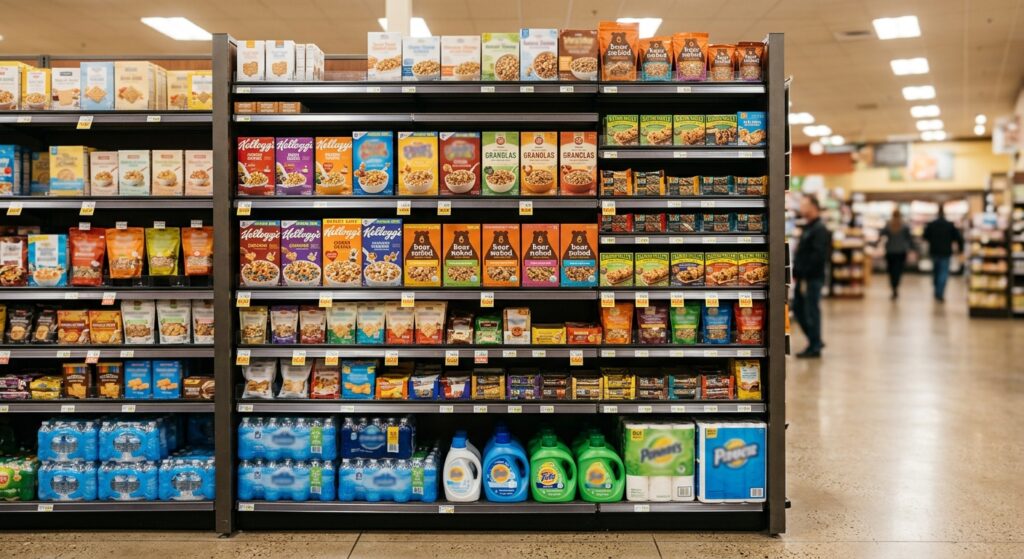
Modern retail is a battle fought at the shelf level. A shopper spends an average of 3–5 seconds scanning a shelf section before making a decision. That window is everything. When shelf space is allocated based on gut feel rather than data, retailers leave measurable revenue on the table.
According to research by InContext Solutions, poor planogram execution directly correlates with lost sales, shopper frustration, and increased labor costs from reactive restocking. The stakes are equally high for consumer packaged goods (CPG) brands competing for premium eye-level positions.
The shift from manual grid-paper layouts to ai-driven, store-specific planning has redefined what “optimized” means. Today, optimization is not a one-time category reset — it is a continuous, data-informed cycle.
Why it matters right now:
- Retail margins are tighter than ever, with grocery net margins averaging 1–3%
- Shopper expectations for product availability and findability have risen sharply
- AI agents can now simulate hundreds of shelf configurations before a single product moves
- Execution gaps between planned and actual shelf conditions cost retailers an estimated 4% of annual revenue
How Did Planogram Optimization Evolve? A Brief History
Understanding the evolution helps teams avoid repeating the mistakes of earlier eras.
1970s–1990s: Grid Paper and Intuition Category managers drew shelf layouts by hand. Decisions relied on vendor relationships and limited sales data. Facings were often assigned based on negotiation, not performance.
2000s: Digital Blueprints and Compliance Software tools enabled planners to create digital shelf diagrams. The focus shifted to execution — ensuring stores actually implemented the planned layout. Compliance became the KPI.
2010s: Data-Driven Planning Point-of-sale data, loyalty card data, and shopper research began feeding planning tools. Space elasticity models — measuring how additional facings affect sales velocity — became standard practice.
2020s–2026: From the 2020s into 2026, AI and autonomous execution have transformed retail merchandising. Store-specific planogram optimization powered by AI now accounts for local demand signals, store format, demographics, and replenishment cycles simultaneously. AI-driven systems can generate, test, and refine layouts with minimal human input.

What Are the Core Principles of Effective Shelf Planning?
Strong planning begins with a set of well-established principles that every retail category manager should internalize.
How Does Space Elasticity Work?
Space elasticity measures the percentage increase in sales generated by adding one additional facing to a product. Research consistently shows that these gains are non-linear: the first facing delivers the highest incremental lift, while additional facings yield diminishing returns.
Key insight: allocating facings based solely on sales volume — rather than space elasticity — misallocates shelf space. High-margin, lower-velocity items often deserve more facings than raw sales data suggests.
Where Should Products Be Placed on the Shelf?
Shelf placement follows a hierarchy based on shopper eye movement and reach patterns:
| Shelf Zone | Height Range | Shopper Behavior | Best Use |
|---|---|---|---|
| Eye Level | 48–60 inches | Highest attention, easiest reach | Hero SKUs, high-margin items |
| Grab Level | 36–48 inches | Natural reach zone | Core everyday products |
| Stretch Level | 60–72 inches | Secondary attention | Bulk sizes, secondary brands |
| Stoop Level | Below 36 inches | Low attention, effort required | Low-margin, heavy, large items |
Eye-level shelf real estate commands premium placement fees from brands for a reason: it converts. Brands that understand category management strategy allocate their best-performing SKUs to these zones first.
How Many Facings Does a Product Actually Need?
The minimum facing count for a product to be “shoppable” — visible enough to trigger purchase — is generally accepted as 1–2 facings for small pack sizes. However, high-velocity items require enough facings to maintain on-shelf availability between replenishment cycles.
The formula is straightforward:
Minimum Facings = (Daily Sales Velocity × Replenishment Cycle in Days) ÷ Units Per Facing
Any facing count below this threshold creates stockout risk. Any count significantly above it wastes shelf space that could serve other SKUs.
What Are the Biggest Challenges in Planogram Execution?
Planning a perfect shelf layout is one thing. Getting it executed consistently across dozens or hundreds of stores is another challenge entirely.
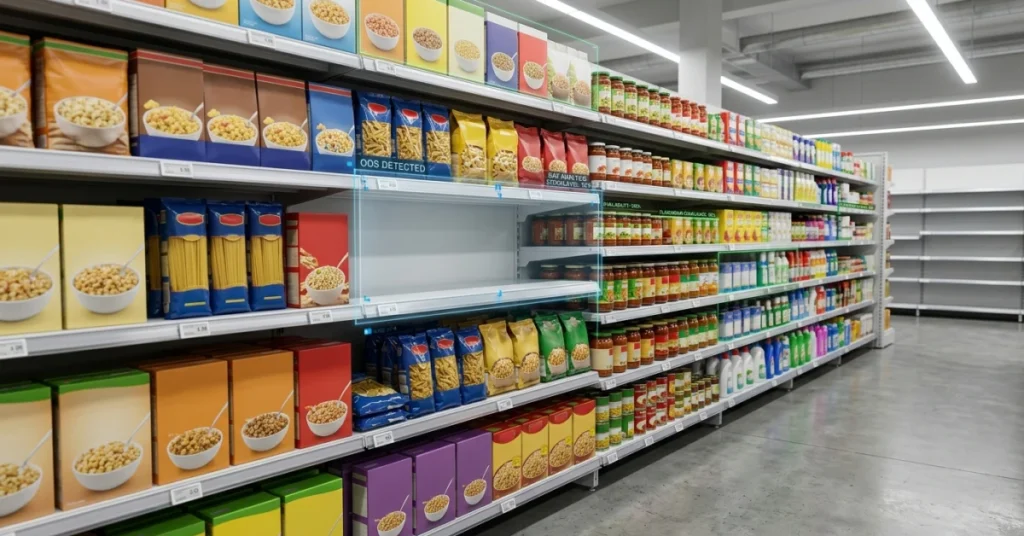
The Compliance Gap: Why Planned ≠ Actual
Industry data shows that planogram compliance rates in large retail chains hover between 50–70%. That means roughly one-third of shelves do not reflect the approved layout at any given time. Causes include:
- Store associates prioritizing speed over accuracy during resets
- Out-of-stock conditions forcing improvised substitutions
- Vendor representatives repositioning competitor products
- Inadequate training on reset procedures
When execution fails, the research investment behind the planogram yields zero return. This is why execution monitoring has become as strategically important as planning itself.
How Does Store Format Complexity Affect Planning?
A retailer operating 500 stores across urban, suburban, and rural markets cannot apply a single planogram universally. Store dimensions vary. Local shopping preferences differ. A cookie-cutter approach to shelf management produces mediocre results everywhere.
RELEX Solutions’ research demonstrates that store-clustering — grouping locations by format, demographics, and sales patterns — enables retailers to develop tailored planograms that outperform generic templates by 8–15% on sales-per-linear-foot metrics.
How Does AI Transform Modern Planogram Optimization?
AI is not a buzzword in this context — it is a functional shift in how planning works.
What Can an AI Agent Do That Humans Cannot?
A traditional category manager can evaluate perhaps 10–20 shelf configurations before a reset deadline. An ai agent can simulate thousands of configurations in hours, scoring each against sales data, margin targets, shopper flow patterns, and replenishment constraints simultaneously.
Domo’s Product Planogram Navigator is one example of an ai agent designed specifically for retail shelf placement decisions. These tools ingest POS data, inventory levels, and shopper research to recommend optimal layouts without requiring manual data reconciliation.
Key capabilities of ai-powered planogram tools:
- Automated facing calculations based on real-time velocity data
- Demand-driven shelf allocation that adjusts for seasonality and promotions
- Compliance monitoring using image recognition to compare actual shelf conditions against planned layouts
- Scenario modeling to test new product introductions before committing to a reset
How Does Virtual Reality Fit Into Planogram Research?
Before committing to a physical reset — which can cost thousands of dollars in labor — retailers and brands now use 3D virtual store environments to test layouts. As InContext Solutions explains, virtual reality enables teams to validate research findings with real shoppers navigating digital shelf environments, dramatically reducing the cost and risk of layout changes.
Shoppers interact with virtual shelves the same way they would in a physical store. Eye-tracking data, dwell time, and purchase decisions are captured and analyzed. The result is a validated planogram before a single product moves.
For teams managing retail field operations, this capability eliminates the expensive trial-and-error of live store tests.
How Should Field Teams Monitor Planogram Compliance?
Designing the optimal shelf layout is only half the job. Verifying that it was implemented — and stays implemented — requires a systematic field monitoring process.
Field representatives need clear standards: what a compliant shelf looks like, how to document deviations, and how to escalate issues. Photo-based audits, where field agents capture shelf images and submit them against a compliance checklist, are the industry standard.
Modern retail execution platforms take this further by using image recognition ai to automatically score shelf photos against the approved planogram. Teams receive real-time compliance dashboards rather than waiting for manual audit reports.
For brands managing large field teams, the ability to track merchandising execution across multiple locations in real time is a direct revenue protection tool. Every hour a shelf sits out of compliance is lost sales potential.
The Role of Shopper Research in Planogram Design
No planogram performs well without a foundation of genuine shopper insight. Data tells you what happened; research tells you why.
What Research Methods Inform Shelf Planning?
Explorer Research outlines several research methodologies specifically designed to support planogram decisions:
- Eye-tracking studies: Measure exactly where shoppers look on a shelf and for how long, identifying blind spots and high-attention zones
- Virtual store research: Expose shoppers to multiple shelf configurations and measure purchase behavior without physical store disruption
- Shopper intercept interviews: Capture qualitative decision-making logic that quantitative data cannot explain
- Biometric response measurement: Track emotional and physiological responses to shelf layouts to identify friction points
These research inputs directly inform facing allocation, product sequencing, and cross-merchandising decisions. Teams that skip this step rely on assumptions that may not reflect how their specific shoppers actually navigate the category.
Integrating shopper research with retail analytics and reporting tools creates a feedback loop that continuously improves shelf performance over time.

Frequently Asked Questions (FAQ)
What is the difference between a planogram and planogram optimization?
A planogram is a visual diagram specifying where products should be placed on a shelf. Planogram optimization is the analytical process of determining the best possible version of that diagram — using sales data, space elasticity models, shopper research, and AI — to maximize revenue, margin, and shopper satisfaction per linear foot of shelf space.
How often should planograms be updated?
Most retailers conduct formal category resets 2–4 times per year. However, best-in-class retailers using ai-powered planning tools review planogram performance monthly and make targeted adjustments in response to velocity changes, new product introductions, and seasonal demand shifts. High-velocity categories like beverages and snacks may warrant more frequent reviews.
What KPIs should be tracked to measure planogram performance?
The most actionable KPIs include: sales per linear foot, gross margin return on space (GMROS), on-shelf availability rate, planogram compliance rate by store, and stockout frequency by SKU. These metrics should be measured at 4-week and 12-week intervals following each reset to isolate the impact of layout changes from other variables.
Conclusion
Planogram optimization in 2026 is a discipline that spans research, data science, field operations, and technology. The retailers and brands that treat it as a continuous process — rather than a periodic project — consistently outperform peers on sales density, margin per square foot, and shopper satisfaction scores.
The competitive advantage lies in closing the loop: rigorous shopper research informing smart shelf planning, ai agents accelerating scenario analysis, and disciplined field execution ensuring the plan reaches every shelf in every store. Each link in that chain must hold.


