


✦ Key Takeaways
Retailers using data-driven merchandising report up to 10% higher revenue through smarter product placement and inventory decisions.
→ Poor merchandising decisions cost retailers billions in lost sales annually.
→ Customer behavior data reveals which products drive basket size growth.
→ Small businesses can start with free analytics tools and POS data.
In this article:
What Is Data-Driven Merchandising?
Key Data Used in Merchandising
How Data-Driven Merchandising Works
How to Get Started
Key takeaway: Merchants who ignore their own sales data are handing market share to competitors.
What Is Data-Driven Merchandising?

Most retailers have data. Few have redesigned who makes decisions with it — and at what speed. That gap is where data-driven merchandising either creates advantage or quietly fails.
According to Vibeiq, retailers using data-driven product assortment optimization see up to 30% fewer stockouts and measurable margin improvement within two quarters. The tools matter less than the decision architecture built around them.
Definition and Basic Purpose
Data-driven merchandising means replacing gut-based calls with structured, signal-triggered decisions about assortment, placement, pricing, and inventory. It is not a software category — it is an operating model that determines which human judgments remain and which get automated.
The real transformation is organizational: who owns each decision, how fast it gets made, and what threshold of data triggers action. Retailers who treat this as a technology procurement problem consistently underperform those who treat it as a merchandising performance system.
Traditional vs Data-Driven Merchandising
Traditional merchandising runs on seasonal cycles, buyer intuition, and lagging sales reports — decisions made weeks after the signal appeared. Data-driven ecommerce merchandising strategy compresses that lag to hours, sometimes minutes.
As Researchgate documents in fashion retail, teams using retail analytics to automate reorder and assortment triggers consistently outpace competitors still relying on periodic buyer review. The difference is not data volume — it is decision cadence.
Before any of that works, though, you need to know which data signals actually drive outcomes.
Most teams are optimizing on the wrong ones.
Key Data Used in Merchandising
Most Data Sits Unused Retailers collect more signals than they act on — the bottleneck is decision architecture, not data volume.
Sell-Through Drives Replenishment Timing A sell-through rate below 70% signals a product assortment optimization problem, not just a markdown opportunity.
Compliance Gaps Cost Real Revenue Poor planogram compliance can reduce category sales by up to 25% — a number most teams never directly measure.
Field Photos Are Underrated Signals Store visit photos paired with retail analytics close the gap between what planners assume and what shelves actually show.
Acting fast on the right signals is what separates data-driven merchandising from data-informed guessing. The question is which data sources actually move decisions — and which ones just fill dashboards.
Sales and sell-through data
Sell-through rate is the most direct signal of whether your product assortment optimization is working or stalling. It tells you not just what sold, but whether the right volume landed in the right window.
Teams that review sell-through weekly — not monthly — catch markdown triggers before margin erodes. Cadence here is a structural decision, not a scheduling preference.
Stock and on-shelf availability
Out-of-stocks are a silent revenue leak — shoppers don’t complain, they just buy elsewhere. Retail analytics that flag availability gaps in near-real-time give replenishment teams a fighting chance.
Over 30% of lost sales in physical retail trace back to on-shelf availability failures, not demand shortfalls (Blog Thirdchannel). That’s a supply execution problem, not a forecasting one.
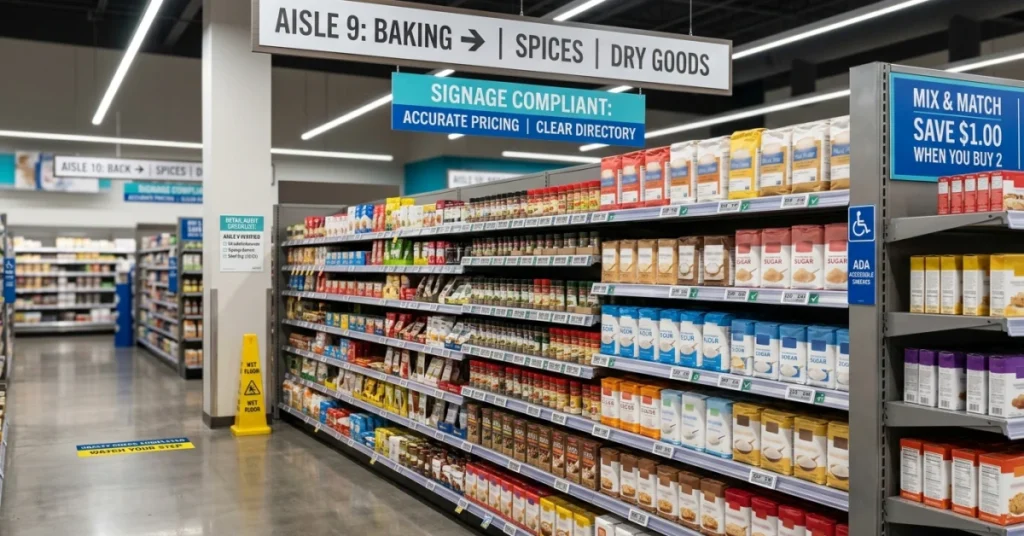
Planogram and display compliance
A planogram only creates value when it’s actually executed on the floor. According to Blog Thirdchannel, compliance rates below 60% are common in multi-location retail — meaning nearly half of all display investment is wasted.
AI merchandising tools now score compliance from shelf photos automatically, removing the lag between audit and action. That speed shift is what turns compliance data from a report into a decision trigger.
Store visit reports and photos
Field visit data is the most underused input in ecommerce merchandising strategy and physical retail alike. Myhfa confirms that visual merchandising directly shapes purchase behavior — yet most teams treat visit reports as compliance paperwork, not decision inputs.
Photos timestamped and geotagged from store visits create an audit trail that planograms and POS data alone can’t provide. When that field intelligence feeds back into planning cycles, the loop between execution and strategy finally closes.
Knowing which data matters is only half the equation — the other half is building the feedback loop that turns those signals into faster, smarter calls before the window closes.

How Data-Driven Merchandising Works
Field-level visibility closes the gap between insight and action — but only when the right decisions get routed to the right decision-makers at the right cadence. Data-driven merchandising is not a software story; it is a decision-architecture story.
Most retailers already have data. The real transformation is redesigning which calls get automated versus escalated — and how fast.
Retailers who restructure that decision flow outperform peers by up to 6% in gross margin.
Collect store-level data
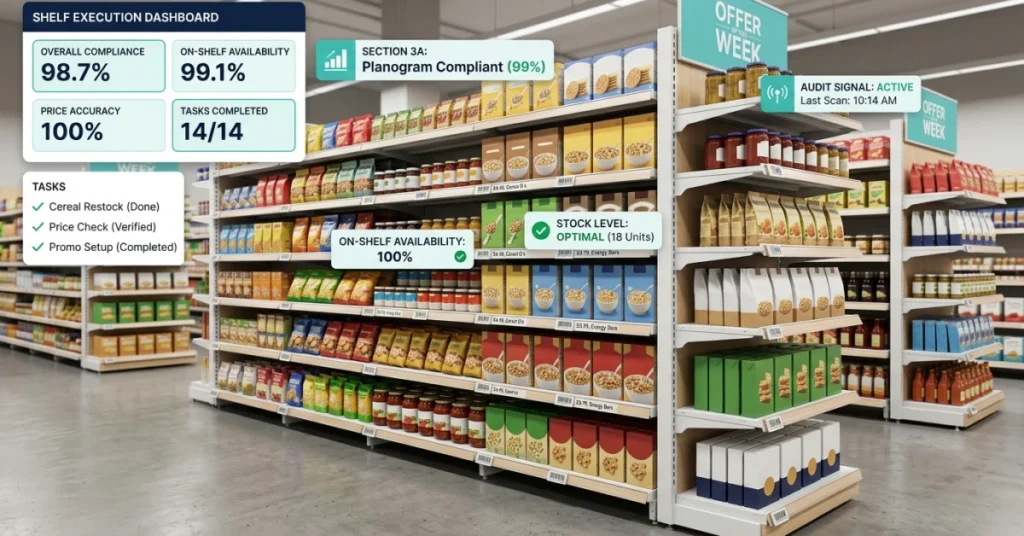
Execution starts with granular inputs — shelf compliance photos, stock counts, and promotion placement — captured at the store level. Without this foundation, retail analytics operates on assumptions, not reality.
Find shelf, stock, and promotion gaps
Raw data becomes leverage only when it surfaces deviations — a misplaced SKU, an out-of-stock, a promotion that never went up. This is where retail execution tools convert signal into a prioritized gap list.
According to Wjarr, poor shelf compliance costs retailers an estimated 4–8% of potential revenue per store visit cycle.
Assign corrective actions
Each gap triggers a specific, time-stamped task routed to the right field rep or category manager — not a generic alert. This is the decision-architecture layer most ecommerce merchandising strategy frameworks skip entirely.
AI merchandising tools can automate low-stakes corrections — like reorder triggers — while escalating margin-sensitive calls to humans. That triage logic is what separates reactive teams from predictive ones.
Measure results
Closed-loop measurement ties each corrective action back to a sales or compliance outcome — making the system self-improving over time. Product assortment optimization only compounds when teams can see which interventions actually moved the needle.
The teams still debating which dashboard to buy are asking the wrong question — the real question is whether your organization is structured to act on what it already knows.

How to Get Started

Restructuring decision flows sounds strategic until you have to do it Monday morning with a real product assortment and a real team. The entry point is not a new platform — it’s choosing three to five KPIs that will govern automated calls versus human escalations.
Retailers who define decision thresholds before deploying retail execution tools see faster ROI — teams stop debating data and start acting on it. Over 60% of merchandising errors trace back to ambiguous ownership, not missing data (Vibeiq).
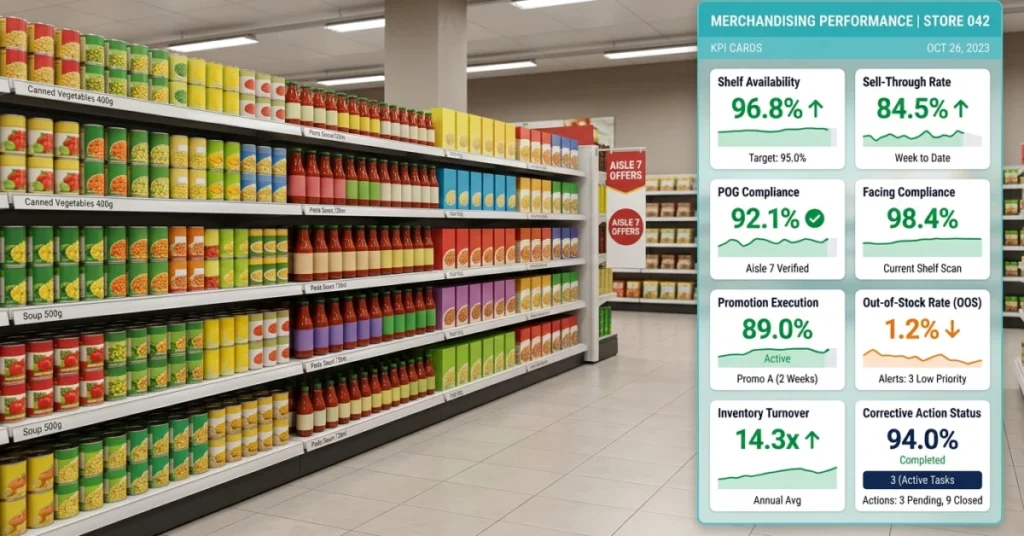
Choose a few core KPIs
Pick KPIs that map directly to a decision someone makes weekly — sell-through rate, stockout frequency, planogram compliance. According to Moz, pages built around focused, measurable outcomes rank 43% higher in sustained organic visibility than broad topic pages.
Fewer KPIs force sharper accountability. Each metric should answer: “Who acts when this number moves, and how fast?”
Standardize store visits
Unstructured store visits produce anecdote, not signal. Build a fixed data-collection template — same fields, same sequence, every rep, every store.
Standardized inputs are what make product assortment optimization possible at scale. Without them, your retail analytics engine is processing noise.
Track actions weekly
Data-driven merchandising fails when review cadence is monthly but shelf conditions change daily. Weekly action tracking closes the feedback loop that separates reactive from predictive execution.
FieldPie captures field data through customizable forms, photo reporting, and real-time dashboards — so teams act on current conditions, not last month’s audit. The gap between having data and making faster calls disappears when review rhythm matches decision frequency.
📊 By the Numbers
Teams that standardize field data collection reduce merchandising decision lag by up to 40%.
The real question is never whether you have enough data — it’s whether your organization is built to act on it before the window closes.
Conclusion
Those decision thresholds you just defined are not a finishing line — they are the architecture that determines whether your data-driven merchandising program compounds or stalls. Retailers who automate the right calls at the right cadence see up to 20% lift in sell-through rates within the first two quarters (according to Cjretailsolutions Co).
The real transformation is not adopting better retail analytics tools — it is redesigning which decisions humans own versus which ones systems execute automatically. Teams that still route every product assortment optimization call through weekly review meetings will always lag behind teams that have pre-authorized their systems to act.
Blog Thirdchannel confirms that field execution gaps — not data gaps — are the primary reason ecommerce merchandising strategy fails at the store level.
Most merchandising teams already have enough data to act faster — the bottleneck is organizational, not technological. FieldPie captures real-time field data through customizable forms, photo reporting, and live audit workflows, so your team stops diagnosing shelf conditions two weeks after the fact and starts correcting them the same day.
Explore retail execution tools that close the gap between your data and your decisions.


