


✦ Key Takeaways
Retailers tracking 5+ merchandising KPIs consistently outperform competitors by up to 30% in gross margin.
- → Wrong KPIs cost retailers millions in unsold, aging inventory.
- → Sell-through rate exposes dead stock before it drains cash.
- → Tracking GMROI reveals which products actually earn their shelf space.
In this article:
- What Are Merchandising KPIs?
- Core Merchandising KPIs Every Retail Team Should Track
- Merchandising KPI Formulas and Examples
Key takeaway: Master your merchandising KPIs or surrender profit decisions to guesswork.
What Are Merchandising KPIs?
Most retail teams are drowning in data but starving for direction — tracking dozens of metrics that describe performance without driving it. Merchandising KPIs are only valuable when each one connects directly to a decision someone on your team can act on this week.
A KPI without a mapped action is just a number. According to Planohero, retailers who actively track shelf availability KPIs reduce out-of-stock rates by up to 30% — but only when those metrics trigger a restocking or planogram review within 48 hours.
Tableau identifies sell-through rate and inventory turnover among the most actionable retail performance metrics — precisely because each one answers a specific business question, not just a reporting requirement. Understanding cross-merchandising strategy becomes far more powerful once you know which KPIs expose where product adjacency is failing.
Merchandising KPI meaning in retail operations
In retail operations, key performance indicators in merchandising are quantified signals tied to product placement, availability, pricing, and sell-through. They exist to surface the gap between your merchandising intent and what’s actually happening on the floor.
The teams that outperform don’t have more metrics — they have fewer, better-chosen ones, each mapped to a specific role and a specific action. The real question isn’t what you’re measuring; it’s whether every number on your dashboard could justify its existence by naming the decision it drives.
Core Merchandising KPIs Every Retail Team Should Track
The metrics that actually move product share one trait: each one answers a specific business question your team can act on this week.
- Sales per Square Foot: Measures revenue efficiency by location, exposing underperforming zones that need immediate fixture or assortment changes.
- Sell-Through Rate: Reveals whether your buying decisions matched actual demand — low rates signal markdown risk before it compounds.
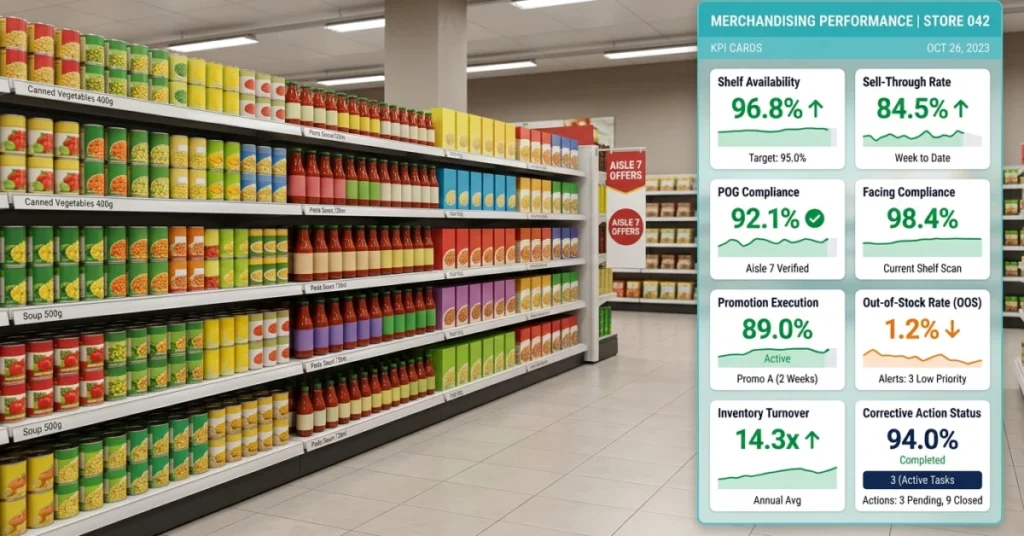
- On-Shelf Availability: Tracks whether the right product is physically present when a shopper reaches for it — the most direct driver of lost sales.
- Planogram Compliance Rate: Quantifies how consistently store teams execute the shelf strategy your category managers designed.
- Inventory Turnover: Flags slow-moving SKUs that tie up working capital and crowd out higher-velocity products.
- Promotion Execution Rate: Confirms that promotional displays are live on the correct dates — because a promotion that isn’t executed is pure margin waste.
Sales per square foot
This metric divides total net sales by total selling area in square feet. It immediately tells a floor manager which zones are underperforming and need a reset.
Top-performing grocery retailers average $600–$900 in sales per square foot annually. Anything below your category benchmark is a direct mandate to restructure that space.
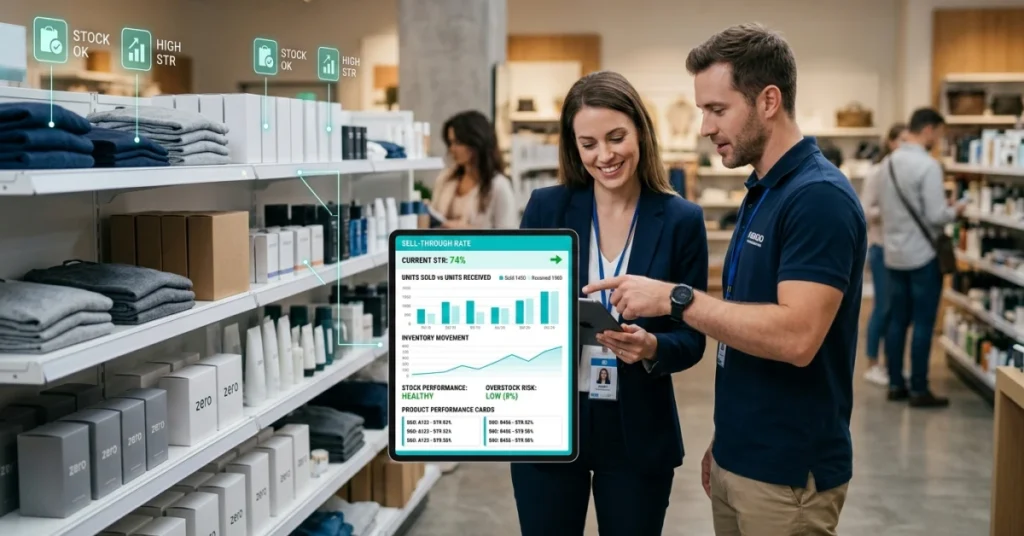
Sell-through rate
Sell-through rate measures the percentage of inventory sold versus what was received in a given period. A rate below 80% in a fast-turn category is an early markdown warning.
This KPI connects buying decisions directly to floor performance — making it one of the most actionable retail merchandising metrics available to any category team.
Stock availability / on-shelf availability
On-shelf availability measures whether a product is physically present and shoppable at the moment of purchase intent. It is the single most direct link between merchandising execution and revenue.
Retailers with strong on-shelf availability programs consistently reduce lost sales by double digits — making this a non-negotiable visual merchandising KPI for any field team.
Out-of-stock rate
Out-of-stock rate tracks the percentage of SKUs unavailable for purchase at any given audit point. Even a 1% improvement in out-of-stock rate can recover significant weekly revenue at scale.
This metric demands a replenishment action, not just a report — which is exactly what separates decision-driving retail performance metrics from passive dashboards.
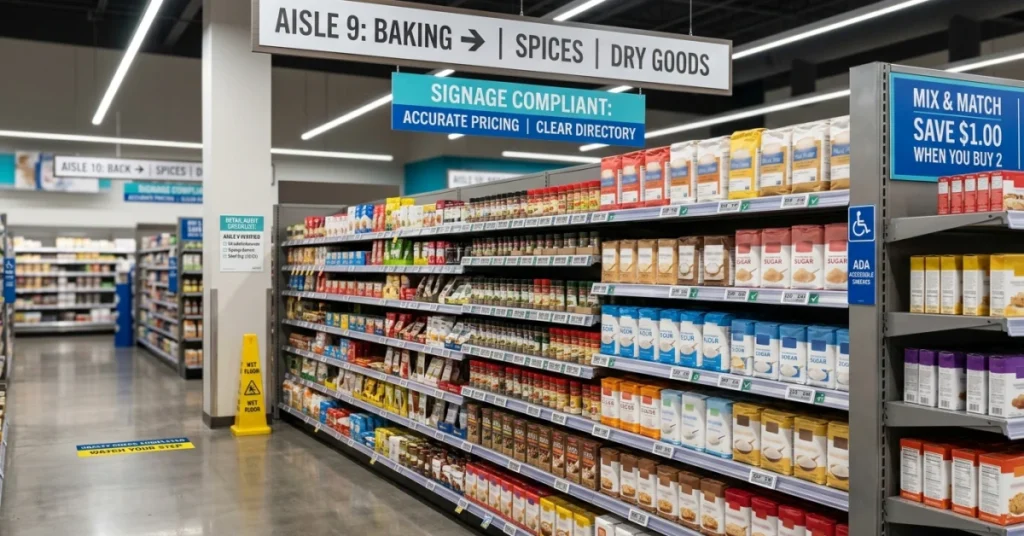
Planogram compliance rate
Planogram compliance rate measures the percentage of SKUs shelved exactly as the approved planogram specifies. Non-compliance directly undermines every category strategy your team built upstream.
Retail teams that audit compliance weekly — not quarterly — catch drift before it erodes sales velocity. This is a key performance indicator in merchandising that demands field accountability.
Share of shelf
Share of shelf measures your brand’s facings as a percentage of total category facings at a given retail location. It is a direct proxy for competitive visibility at the point of purchase.
Brands with higher share of shelf consistently outperform competitors in impulse-driven categories — making this one of the most competitive visual merchandising KPIs to monitor.
Facing compliance
Facing compliance confirms that each SKU has the correct number of product faces visible to the shopper. Fewer faces mean less visual impact and lower likelihood of purchase.
This metric is only useful if a rep can correct it on the same visit — otherwise it is observation, not execution.
Display compliance
Display compliance tracks whether secondary displays — end caps, floor stands, clip strips — are built to spec and in the correct location. A display in the wrong aisle is invisible to the shopper it was designed to reach.
According to Gopazo, non-compliant secondary displays can reduce promotional lift by up to 30% — a direct cost of poor execution that most teams never measure.
Promotion execution rate
Promotion execution rate measures the percentage of planned promotional activities correctly implemented across all stores by the campaign launch date. Every percentage point of non-execution is paid promotional spend with zero return.
Brands that track this metric in real time — not post-campaign — recover margin that would otherwise disappear into audit reports nobody acts on.
Inventory turnover
Inventory turnover measures how many times your total inventory is sold and replaced within a defined period. Low turnover locks working capital in slow-moving SKUs that crowd out better performers.
Retailers with optimized inventory turnover free up cash that funds faster replenishment cycles — which is why this ranks among the most consequential merchandising KPIs on any dashboard.
Product availability by location
This metric breaks availability data down to the individual store or region, exposing location-specific gaps that aggregate numbers hide. A 95% national availability rate can mask a 60% rate in your top 20 stores.
Granular location data turns a passive retail performance metric into a precise field dispatch — which store, which SKU, which rep, this week.
Store visit completion rate
Store visit completion rate tracks the percentage of scheduled field visits actually completed within the planned time window. Missed visits mean unaudited shelves, unexecuted displays, and uncorrected compliance gaps.
E-commerce teams face a parallel challenge — Algolia reports that 43% of shoppers go directly to search, meaning digital shelf gaps are just as costly as physical ones when left unaddressed.
Corrective action completion rate
This metric measures the percentage of identified compliance issues that are resolved within a defined SLA window. An audit that generates findings nobody fixes is a cost center, not a performance tool.
Corrective action completion rate is the final proof that your key performance indicators in merchandising are connected to real-world outcomes — not just dashboard entries.
Knowing which metrics to track is only half the equation — the other half is knowing exactly how to calculate them and what a good number actually looks like in practice.

Merchandising KPI Formulas and Examples
Formulas turn weekly tracking into decisions — here are the exact calculations your team should run.
Sell-through rate formula
Sell-through rate = (Units Sold ÷ Units Received) × 100. A rate below 80% signals a buying, pricing, or placement problem — not a customer problem.
If you received 500 units and sold 390, your sell-through is 78% — a direct trigger to review shelf placement or run a markdown.
Sales per square foot formula
Sales per square foot = Net Sales ÷ Total Selling Area (sq ft). Top-performing U.S. retailers average $325–$500 per square foot annually.
A drop in this metric tells you a specific zone is underperforming — which is why retail merchandising strategy must map every SKU to a revenue-per-foot target.
Inventory turnover formula
Inventory turnover = Cost of Goods Sold ÷ Average Inventory Value. Most grocery retailers target a turnover of 12–15x per year; apparel targets 4–6x.
Low turnover means capital is locked in slow-moving stock — a buying decision failure, not a store execution failure.
Out-of-stock rate formula
Out-of-stock rate = (SKUs Out of Stock ÷ Total SKUs Tracked) × 100. The global retail average sits near 8%, costing the industry roughly $1 trillion annually in lost sales.
Every percentage point above your target is a replenishment decision that someone failed to make in time.
Planogram compliance formula
Planogram compliance = (Compliant SKU Facings ÷ Total Required Facings) × 100. Compliance below 90% directly erodes the sales lift a planogram was designed to generate.
This metric answers one question: did the store execute what the merchandising team decided — yes or no?
Promotion compliance formula
Promotion compliance = (Stores Executing Promo Correctly ÷ Total Stores Audited) × 100. A score below 85% means your promotional ROI projections are built on a false assumption.
Track this metric within 48 hours of a promotion launch — not after the campaign ends.
| KPI | Formula | Benchmark | Action Trigger |
|---|---|---|---|
| Sell-through Rate | (Units Sold ÷ Units Received) × 100 | ≥ 80% | Review placement, adjust replenishment, or initiate markdown |
| Sales per Sq Ft | Net Sales ÷ Selling Area | $325–$500/year for strong-performing retail spaces | Reassign zone, reset category, or improve product visibility |
| Inventory Turnover | COGS ÷ Average Inventory Value | 4–6x for apparel; 12–15x for grocery/FMCG | Reduce overstock, review buying decisions, or rebalance inventory |
| Planogram Compliance | Compliant Displays ÷ Total Checked Displays × 100 | ≥ 90% | Recheck shelf execution and assign corrective actions |
| Out-of-Stock Rate | OOS SKUs ÷ Total SKUs Checked × 100 | ≤ 5% | Investigate replenishment gaps or phantom inventory |
| Promotion Compliance | Correctly Executed Promotions ÷ Total Planned Promotions × 100 | ≥ 95% | Fix display setup, pricing, POS materials, or store communication |
| Facing Compliance | Correct Facings ÷ Planned Facings × 100 | ≥ 90% | Adjust shelf layout or retrain store teams |
| Corrective Action Closure Rate | Closed Actions ÷ Total Assigned Actions × 100 | ≥ 90% within target deadline | Escalate unresolved issues or review field accountability |
Conclusion
Merchandising KPIs only matter when they lead to action. A good dashboard should not just show store performance; it should help teams see what to fix, where to focus, and which execution gaps need attention.
Metrics like sell-through rate, planogram compliance, out-of-stock rate, promotion execution, and corrective action closure become more valuable when they are reviewed quickly and tied to store-level decisions.
FieldPie helps merchandising teams connect KPI tracking with real execution through mobile forms, photo-based reporting, store visit checklists, and corrective action workflows. In the end, strong merchandising performance comes from measuring the right things and acting on them fast.


