✦ Key Takeaways
Home service businesses that track KPIs grow revenue up to 3x faster than those flying blind.
→ Untracked financials silently drain margins below 10%.
→ Low technician utilization rates kill profitability before owners notice.
→ Dispatch efficiency directly determines how many jobs you win daily.
In this article:
What Are Home Service Business KPIs?
Essential Financial KPIs
Technician Productivity KPIs
Scheduling and Dispatch KPIs
Key takeaway: The KPIs you ignore today are the profits your competitors will take tomorrow.
What Are Home Service Business KPIs?
Most home service owners track the wrong things. They watch job count, revenue, and calls booked. Then they wonder why profit stays flat despite a packed schedule.
Home service business KPIs are specific, measurable signals. They tell you whether your operation is actually healthy, not just busy.
Over 60% of service contractors who fail within five years report strong early revenue. They had weak control over job costs and technician output (Cornerstonead).
A full calendar is not proof of a profitable business.
The real problem starts upstream in dispatch and scheduling. It shows up long before a revenue number appears. Home service dispatching sets the ceiling on every financial outcome your business can reach.
Operational, Financial, and Customer KPIs
Key performance indicators for home services fall into three buckets: operational, financial, and customer. Each bucket measures a different layer of your business. They are not equal in priority.
Operational KPIs — like technician utilization and jobs completed per day — drive the other two. Fix those first, and financial and customer metrics follow.
Leading vs. Lagging Indicators
Lagging indicators like monthly revenue tell you what already happened. Leading indicators tell you what is about to happen to your margin.
Same-day booking rate and drive time per job are leading indicators. Track them and you can act before profit takes a hit.
According to Contractoraccelerator, contractors who track leading KPIs weekly grow profit 2x faster than those who review numbers monthly. Most owners only watch lagging data. That means they react instead of prevent.
Knowing the categories is just the start. The real question is simple: which financial numbers separate a thriving home service business from one that only looks like it’s winning?
Essential Financial KPIs
Profit gaps don’t start at the invoice. They start hours earlier, in choices your dispatch board already made.
Revenue Is a Vanity Number: A full schedule with poor routing still bleeds margin on every job.
Gross Profit Margin: This shows what’s left after direct labor and materials. That’s before overhead takes the rest.
Net Profit Margin: Industry benchmarks sit around 10–15%. Falling below that signals a structural problem, not a slow month.
Customer Acquisition Cost (CAC): If CAC exceeds average job value, growth actively destroys profit.
Average Job Value: Track this alongside home service performance metrics. It shows whether upsells or pricing gaps are the real issue.
Revenue per Technician: This single number ties your financial results directly to field efficiency.
Revenue per Technician
Most owners track total revenue. Few divide it by headcount. That one step shows whether you’re growing or just adding payroll.
A technician earning under $150,000 a year often points to dispatch problems. It’s rarely a skills issue. Fix the schedule first.
Average Job Value
Low average job value usually means one of two things: underpricing or missed upsells in the field. Both are fixable.
Businesses that actively track this KPI report faster revenue gains. Those chasing new customer volume alone fall behind (Homeservicescorecard).
Gross and Net Profit Margin
Gross margin shows whether your pricing covers direct costs. Net margin shows whether your business model actually works.
Home service businesses with strong dispatch systems beat peers on net margin. Field operations drive the financial result (Greenbaumstiers).
Customer Acquisition Cost
CAC only makes sense next to lifetime customer value. A $200 CAC is fine if a customer books four jobs a year.
High CAC paired with low repeat rates is a problem. Your marketing budget funds a leaky bucket, not growth.
Every KPI here ties back to one thing. It’s how well your technicians use their time in the field.

Technician Productivity KPIs
Those structural decisions show up first in your technicians’ daily numbers — not in your bank account. Fix the field-level metrics, and the financials follow.
Most owners track revenue and call volume, then wonder why margins stay thin. The real answer lives in four specific home service business KPIs that measure what each technician actually produces per shift.
Jobs Completed per Day
This is the simplest productivity signal — and the most ignored. A technician completing 4–6 jobs per day versus 2–3 is a margin difference that no upsell strategy can close.
Low job counts usually point to routing problems, not slow workers. That’s a dispatch issue, not a training issue.
Technician Utilization Rate
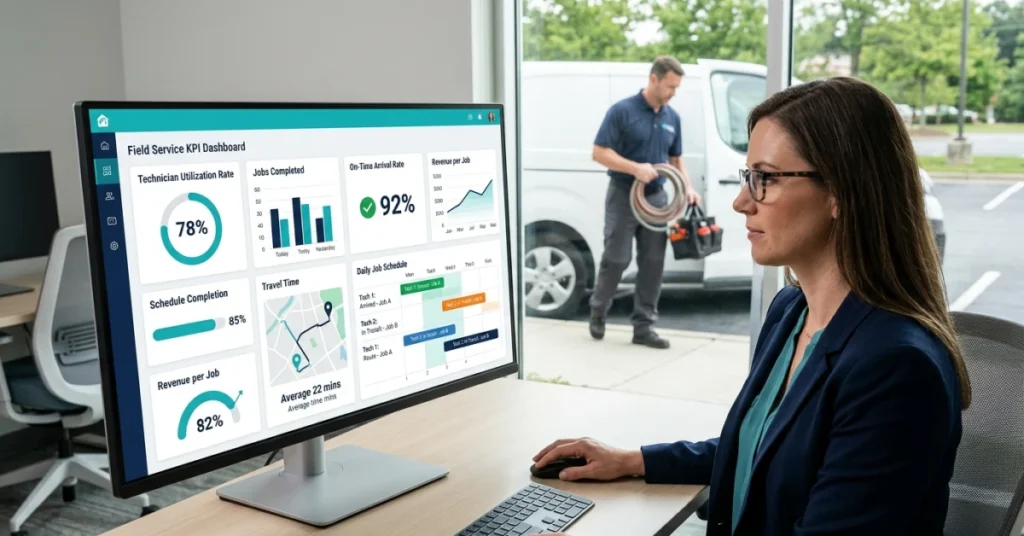
Utilization measures the share of paid hours spent on billable work — not driving, waiting, or doing paperwork. Top-performing home service teams hit 75–85% utilization; most businesses run closer to 55% without knowing it (Cubecreative).
Every point below 75% is paid time producing zero revenue. That gap compounds fast across a team of five or ten techs.
First-Time Fix Rate
A callback costs you a second truck roll, a tech’s time, and often a refund or discount. Businesses that track field audit KPIs consistently report higher first-time fix rates because they catch patterns before they repeat.
Aim for a first-time fix rate above 85%. Anything lower signals a parts, training, or diagnostic process problem worth solving now.
Revenue per Job
Revenue per job tells you whether your pricing and upsell process are working at the field level. Clickcallsell notes that home service businesses tracking per-job revenue see gains in average ticket size. Those gains show up within 90 days of consistent measurement.
Split this KPI by technician. Wide gaps between your top and bottom performers reveal a coaching opportunity — not just a performance problem.
📊 By the Numbers
Most home service teams run at just 55% technician utilization — leaving nearly half of paid hours unbillable.
Even a fully productive technician loses time when dispatch sends them to the wrong job. That’s exactly where the next set of KPIs cuts deepest.
Scheduling and Dispatch KPIs
Jobs-per-day gaps don’t fix themselves. They trace back to broken dispatch before a tech ever leaves the driveway.
Dispatch is upstream of revenue: Every financial KPI you track is already shaped by how well you scheduled that morning.
Small delays compound fast: A 15-minute late start per tech adds up. Across five techs, that erases over an hour of billable capacity every day.
Owners measure the wrong end: Tracking home service quality KPIs alongside dispatch data reveals where margin actually leaks.
Scheduling errors hide in plain sight: A full calendar with poor routing still burns fuel, time, and technician energy. That waste starts before the first job begins.
Dispatch efficiency is measurable: Home service business KPIs around scheduling give owners a lever — not just a report.
On-Time Arrival Rate
On-time arrival rate measures the share of jobs where your tech arrives within the promised window. Top-performing home service companies hit 85% or higher. Most struggling ones don’t track it at all.
Late arrivals don’t just frustrate customers. They compress job time, spike callbacks, and quietly destroy your daily schedule completion rate.
Travel Time Between Jobs
Poor routing can eat 20–30% of a technician’s available work hours each day. That’s not a fuel cost. It’s a capacity problem dressed up as a logistics problem.
Key performance indicators for home services must include average drive time per job. If that number goes above 25 minutes, your dispatch zone or scheduling logic needs a hard look.
Schedule Completion Rate
Schedule completion rate tells you what share of planned jobs your team actually finishes each day. Anything below 90% signals a systemic problem — not a one-off bad day.
Low completion rates mean you’re overscheduling, underestimating job time, or absorbing too many same-day changes. Each cause has a different fix.
None of those fixes show up in a revenue report. Cornerstonead ranks schedule adherence as one of the four most critical KPIs for home service operators.
Cancellation and Rescheduling Rate
Every cancellation is a hole in your schedule. It rarely gets filled at full margin. Home service metrics around cancellation rates expose demand patterns, booking friction, and customer trust gaps all at once.
A cancellation rate above 10% is a warning sign. Your confirmation process, lead time, or customer communication needs work. That’s a fixable system problem — not bad luck.
Contractors who track this KPI weekly catch the pattern early. That’s how you stop it before it becomes a revenue crater.
“Dispatch efficiency isn’t an operational detail — it’s the foundation every other home services performance measurement number is built on.”
Owners who fix their scheduling data don’t just run tighter days. They find that most of what they blamed on slow seasons was actually slow dispatch all along.
Conclusion
Clean dispatch lifts every key number. Revenue, margin, and customer satisfaction all have room to grow.
Fix a broken schedule first. No sales push can save a team that is always behind.
Businesses that track home service business KPIs closely catch problems weeks before they hurt the bottom line.
According to Ciwebgroup, companies that watch technician utilization rates earn up to 23% higher profit margins. That gap is real — and it shows up fast.
Most owners lose margin quietly. The cause is rarely a bad sales month. It is usually idle time no one tracked and poor dispatch calls.
Homeservicescorecard confirms that steady KPI tracking is the single strongest sign of year-over-year revenue growth.
FieldPie links your office and field teams in real time. It tracks job status, technician output, and performance data as it happens.
You spot margin leaks early. You act before small gaps turn into serious losses.
Start measuring what actually drives profit, and your revenue targets become far easier to hit.