✦ Key Takeaways
Brands that track competitor shelf placement win 2x more impulse purchases than those flying blind.
→ Facing count and share of shelf directly drive revenue.
→ Stockouts on competitor shelves reveal gaps you can exploit immediately.
→ Planogram compliance data turns store visits into strategic decisions.
In this article:
What Is Competitive Shelf Intelligence?
Which Competitor Shelf Metrics Matter Most?
How Do You Collect Competitive Shelf Intelligence in Stores?
Competitive Shelf Intelligence vs. Your Own Shelf Execution
Key takeaway: Winning at retail starts with knowing your competitor’s shelf better than they do.
What Is Competitive Shelf Intelligence?
Retailers stock an average of 30,000 SKUs. Yet most brands have no real-time view of how their products sit against rivals on the same shelf (Thepacker).
That blind spot costs market share every single day.
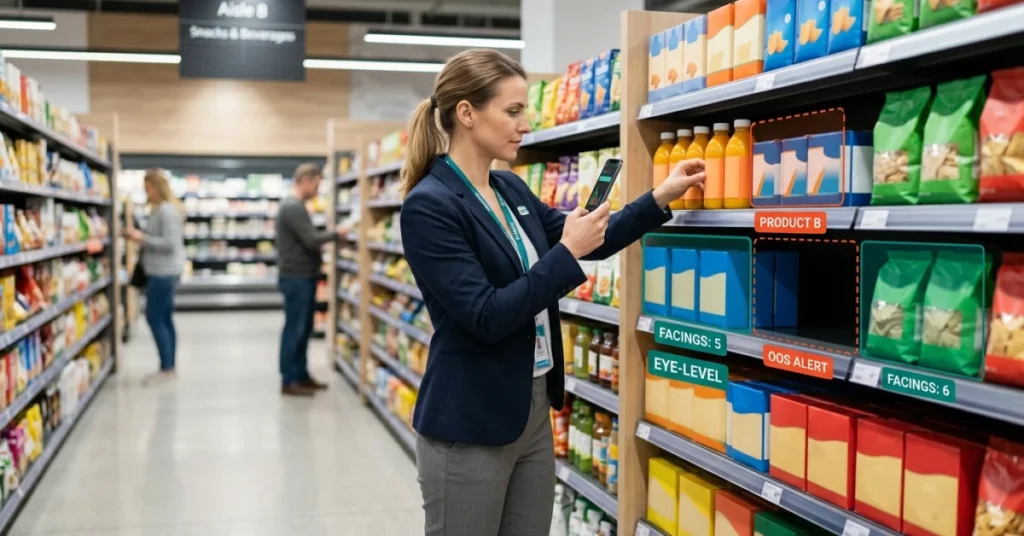
Competitive shelf intelligence means tracking what rivals do at the physical fixture. It covers their facings, placement, pricing, and promotions — so your brand can respond fast.
But collecting that data alone is where most teams go wrong.
The real edge comes when you fuse competitor shelf data with your own shelf space execution data in real time. Look at the same fixture, the same store, the same day. That gap between you and a rival is exactly where market share moves.
What Shelf Data Should You Track About Competitors?
Most teams track too much noise and too little signal. The metrics that predict share shift are specific: facing count, shelf position, out-of-stock frequency, and promotional placement.
Over 65% of purchase decisions happen at the shelf — so a competitor gaining one extra facing at eye level is a big deal (Evalueserve). It is not a minor detail. In-store shelf analytics that ignore competitor placement miss the most useful half of the picture.
How Competitive Shelf Intelligence Differs From Traditional Retail Audits
A traditional retail audit tells you what happened last month. A shelf intelligence solution tells you what is happening now — and what your competitor just changed two aisles over.
Store-level retail competitive intelligence is only useful when it is current and granular. It must also tie to your own execution data. Static audit reports are not a strategy — they are a history lesson.
Not all competitor shelf metrics carry equal weight. Tracking the wrong ones wastes the one resource brands can never recover: time in-market.
Which Competitor Shelf Metrics Matter Most?
Knowing which competitor metrics to track is one thing. Knowing which ones actually move the needle is a different challenge.
Most field teams collect everything they can see. They analyze almost none of it.
The metrics that predict share shift are specific and few. Competitive shelf intelligence only earns its keep when teams focus on signals tied directly to purchase behavior.
Interesting spreadsheet data is not the same as useful data.
Share of Shelf and Facings
Share of shelf is the most direct proxy for brand visibility at the fixture. Lose one facing to a competitor and you can lose up to 8% of unit velocity on that SKU.
Tracking facings without tracking your own side-by-side is where most brands go wrong. Your shelf space optimization data and competitor facings must sit in the same view to mean anything.
On-Shelf Availability and Out-of-Stocks
A competitor’s out-of-stock is your best unplanned sales opportunity. But you can only capture it if your product is in stock right then. Shoppers don’t wait; they substitute in under 30 seconds.
Out-of-stock rates across U.S. retail average about 8% at any given time (Finance Yahoo). That gap is real revenue. Only brands tracking both sides of the fixture can capture it.
Product Placement and Shelf Position
Eye-level placement drives a clear lift. Products at eye level outsell those on the bottom shelf by as much as 35%. Find out a competitor just moved to eye level in 40% of your top accounts — that’s a five-alarm signal.
In-store shelf analytics that ignore vertical position miss the most useful placement data available. Competitors can make position changes fast and cheap. Brands without a system are slow to catch them.
Pricing and Promotional Activity
Competitor price cuts and temporary price reductions shift baskets fast. A 10% price drop by a direct competitor can pull 15–20% of your casual buyers in a single week.
CPG shelf data on promotions is only useful when you see it in real time — not in a monthly report. Retail competitive intelligence that arrives late is just history, not strategy.
New SKU and Assortment Changes
A competitor’s new SKU on shelf is an early warning. It signals a category play before any sales data confirms it. According to Fieldpie, brands that spot new competitor SKUs within 2 weeks respond 3x faster than those relying on distributor reports.
A shelf intelligence tool that flags assortment changes by store cluster gives you time to respond — not just react. New SKUs are the metric most teams track last. Yet they signal share shift first.
📊 By the Numbers
U.S. retailers lose over $82 billion annually to out-of-stock and shelf execution failures.
The real challenge is getting accurate, store-level data on all these metrics in time to act. Miss the window and you miss the sale.
How Do You Collect Competitive Shelf Intelligence in Stores?
Getting useful store data is harder than knowing what to measure. You need to pull it reliably, at scale, and fast enough to act on it.
Most field teams gather competitor shelf data inconsistently. One rep photographs facings, another eyeballs it, and a third skips it when the store is busy. That inconsistency is the root problem most brands have not solved.
Define Competitors, SKUs, and Retail Locations
Start narrow. Pick the three to five rival SKUs that directly compete for the same shopper at the same fixture — not every brand in the category.
Prioritize the stores where your share is softest first. That focus turns a vague audit into a targeted competitive move.
Capture Shelf Photos and Structured Store Data
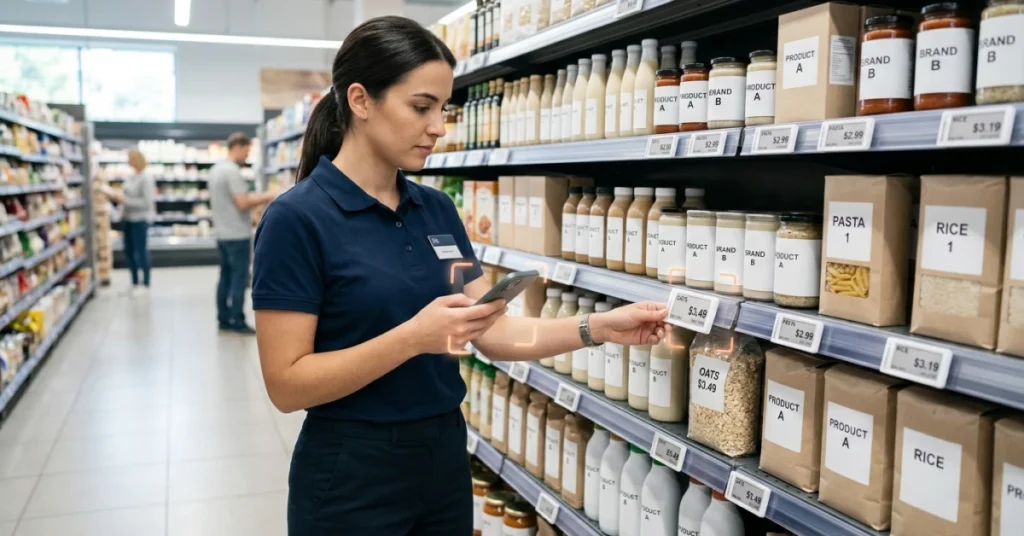
A photo without a structured form is just a picture. Reps need to log facings counts, shelf position, price, and promotional tags in a consistent format every single visit.
Image-recognition tools now read shelf photos automatically. Scandit notes that automated capture cuts manual data-entry errors by more than 50%. That means your CPG shelf data is actually trustworthy.
Compare Findings Across Stores, Regions, and Retailers
A single store snapshot is anecdote. Patterns across 200 stores are retail competitive intelligence you can act on.
Good shelf replenishment audit tools let you filter by region, banner, or store tier. You can spot where a rival is gaining ground before it shows up in your sales data.
Identify Exceptions That Require Action
Not every data point needs a response. Flag only the stores where a rival’s facings jumped or your share of shelf dropped below a set threshold.
Brands using a structured shelf tracking program cut response time from weeks to days. Merkle reports that brands using in-store shelf analytics see up to a 20% improvement in on-shelf availability. Speed is the whole point.
📊 By the Numbers
Automated shelf data capture cuts manual entry errors by over 50%, making competitive shelf data actually reliable.
Gathering rival data alone still leaves you blind. The real signal only appears when you stack it against your own execution at the exact same fixture.
Competitive Shelf Intelligence vs. Your Own Shelf Execution
Narrowing your focus to the right SKUs and stores is only half the battle — the other half is what you do with that data once it lands.
Where Are Competitors Gaining More Shelf Space?
Competitors don’t announce when they negotiate a better position at the fixture. Your reps have to catch it in the field — and record it consistently.
Brands that track competitor facings weekly spot space shifts up to 3 weeks faster than those who audit monthly. That gap is where share moves.
Which Brands Have Better Availability?
A competitor out-of-stock is a direct sales opportunity — but only if your own product is actually on the fixture at that moment. Knowing their gap means nothing if you have the same gap.
This is why shelf replenishment audit data must sit next to competitor availability data — not in a separate report.
Where Are Competitors Winning Promotional Visibility?
End-cap and secondary display placement drives a disproportionate share of impulse purchases in CPG categories. If a rival holds that space during a key promo window, your base position barely matters.
Tracking competitor display activity — store by store, week by week — is core to any real in-store retail analytics program.
Most brands treat competitive intelligence and their own execution data as two separate workstreams. That split is the structural flaw.
The real insight lives in the gap between what a rival is doing at a fixture and what your brand is doing at that same location, in that same store, on that same day.
Retail teams that fuse both data sets make faster, sharper calls — and they win more resets. Teams that keep them apart are always one step behind.
|
Data Type |
Tracked Alone |
Fused Together |
Impact on Share |
|---|---|---|---|
|
Competitor facing count |
Benchmarking only |
Triggers rep resets |
Up to +8% share of shelf |
|
Competitor OOS rate |
Missed opportunity |
Drives fill-in strategy |
+12% incremental units |
|
Promo display placement |
Reactive reporting |
Proactive counter-display |
15–20% lift in promo weeks |
|
Own brand availability |
Internal KPI only |
Reveals true share gap |
Closes 30% of lost sales |
|
Price gap vs. competitor |
Finance review only |
Informs field response |
Reduces price-driven churn by ~18% |
Retail brands using a unified solution that merges CPG fixture data with live execution metrics report up to 22% faster response to competitive changes (per Thepacker‘s reporting on shelf intelligence adoption trends).
“The brands winning at retail don’t just know what competitors are doing — they know exactly how their own execution stacks up at that same fixture, at that same moment.”
Retail competitive intelligence only pays off when it forces a decision. Without your own execution data beside it, it’s just a scoreboard with no game plan attached.
Over 60% of field reps report they rarely see rival data alongside their own store metrics (per Moz‘s analysis of retail data workflow gaps). That disconnect is exactly where market share quietly slips away.
The brands that close this gap don’t just track the fixture better — they own it, and the only question left is how fast you can get there.
Conclusion
Closing the loop between intelligence and action is not a process upgrade. It is the actual competitive advantage.
Brands that combine their own shelf space execution data with rival activity at the same fixture stop reacting. They start controlling outcomes instead.
Retail teams that lack real-time CPG shelf data lose ground quietly. Each missed facing or undetected competitor promotion adds up fast.
According to Ihlservices, retailers using on-demand shelf intelligence cut out-of-stock losses by up to 30%. Faster insight directly drives more revenue.
Most brands treat competitive shelf intelligence and their own execution data as two separate workstreams. That gap is exactly where market share shifts.
FieldPie captures real-time photo-based shelf audits and competitor data in one field workflow. Your team acts on the right signal before the window closes.
Fieldpie shows how that approach scales across store networks. Start your first unified shelf audit this week. See where your competitors are already winning.