✦ Key Takeaways
Up to 20% of field merchandiser time is lost to inefficient routing and manual reporting tasks.
→ Poor shelf compliance directly cuts retail sales by double digits.
→ No real-time data means managers react too late to fix problems.
→ Structured daily task lists can lift rep output by 30%.
In this article:
What Is Field Merchandiser Productivity?
How to Measure Merchandiser Productivity
What Reduces Merchandiser Productivity?
Key takeaway: Fixing merchandiser productivity starts with better data, not more headcount.
What Is Field Merchandiser Productivity?
Most managers track how many stores a rep visits each day. That number alone tells you almost nothing about actual results.
Field merchandiser productivity is about shelf outcomes achieved, not hours logged or miles driven.
Consider this: a rep who completes 12 store visits but leaves half the displays wrong has done less useful work than one who nails 8 visits with full compliance.
The real measure is what changes on the shelf. It is not what gets checked off a list.
Productivity vs. Visit Completion
Visit completion is easy to count. Productivity is harder — it asks whether the visit actually moved the needle on sales, compliance, or shelf presence.
A rep can “complete” a visit in eight minutes without fixing a single planogram gap. That gap costs the brand real revenue every day it sits unfixed.
Key Factors Affecting Field Productivity
Route design, task clarity, and tool quality all shape how much useful work a rep can do. But most teams overlook administrative friction.
Paperwork, unclear instructions, and last-minute task changes quietly eat 30–40% of a rep’s day. That happens before they touch a single shelf.
That hidden time tax is why reducing rep burnout and fixing broken workflows often matter more than pushing reps to move faster.
Measuring Productivity Across Locations
Stores vary in size, layout, and foot traffic. A single visit-count metric misleads you fast.
According to Fieldpie, teams that track KPIs like compliance rate and time-on-shelf see up to a 25% lift in field team performance within the first quarter. That is what happens when you measure more than just visits.
Research from Www2 Census confirms that output gaps across locations often trace back to process and information quality. Individual effort is rarely the root cause.
That finding reframes field merchandiser productivity as a systems problem. It is not a people problem.
If you can’t see where time actually goes during a rep’s day, you’re guessing at fixes. The next section shows you exactly how to stop guessing.
How to Measure Merchandiser Productivity
To track shelf outcomes, you need numbers that reflect real execution. Most teams measure effort instead of impact. That leaves them flying blind.
A rep who visits 12 stores but fixes nothing has zero productive output. The metrics below show you exactly where field execution breaks down.
Essential Field Productivity KPIs
A KPI — short for key performance indicator — is a number that tells you if something is working. For field merchandiser productivity improvement, tie your KPIs to shelf results. Not rep movement.
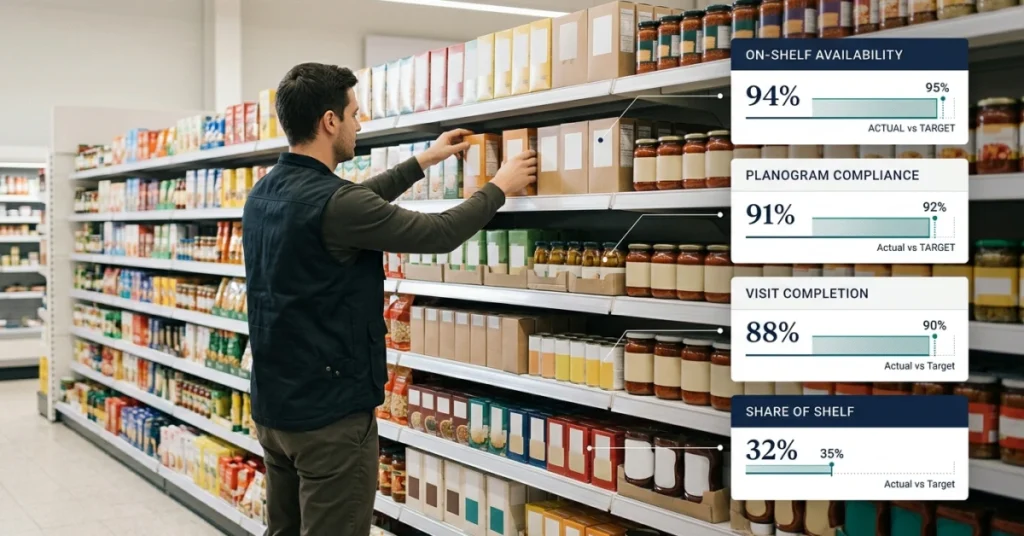
Start with three metrics: compliance rate, task completion rate, and out-of-stock correction rate. These show whether the work actually changed anything on the shelf.
Visits per Day and Time per Visit
Visits per day tells you capacity. Time per visit tells you depth. A rep averaging 8 minutes per store is likely skimming — not executing.
The right balance depends on store complexity. Most teams should target 15–25 minutes of active shelf time per visit. Anything less rarely moves compliance numbers.
Travel Time vs. Productive Time
Travel time is the silent budget drain most managers never measure. Reps who spend 40% of their day in a car deliver only 60% of the value you pay for.
Route planning can cut wasted drive time by up to 20%. But poor territory design often erases those gains fast. Map your reps’ actual day before you redesign anything.
Task Completion and Execution Quality
Task completion rate measures whether assigned work got done. Execution quality measures whether it got done right — correct placement, correct facing, correct pricing.
Teams using digital field execution tools report higher execution quality scores. Reps get clear, photo-verified instructions instead of vague planogram printouts.
Cost per Visit and Team Performance
Cost per visit = total field costs ÷ total store visits. It’s the fastest way to spot whether your team is scaling well or just getting more expensive.
Retail teams with strong manager coaching see up to 2x the store productivity of teams without it. That finding comes from Yoobic.
Emerald research also shows that data-driven performance benchmarking cuts field cost waste by over 15%.
📊 By the Numbers
Strong retail managers can deliver up to 2x the store productivity of their under-coached peers.
Once you see these numbers, one question gets hard to ignore. What is actually eating the hours your reps should spend on the shelf?
What Reduces Merchandiser Productivity?
Once you know which KPIs to track, the next question hits harder: what’s actually eating the time before reps ever reach a shelf? Administrative friction — not poor routing or lazy reps — is the real productivity killer.
Most managers never see it because it doesn’t show up on a store-visit report.
A rep can spend 30–40% of their day on check-ins, paper forms, and last-minute task changes — and still log a “full” day in the system. That’s a systems design failure, not a people problem.
Inefficient Routes and Travel Time
Unplanned routes force reps to double back across territories, burning hours that should go toward shelf work. Poor routing alone can cut the number of productive store visits by 20% or more on a single day.
Smart visit frequency planning reduces dead miles and keeps reps focused on execution, not navigation.
Poor Scheduling and Unbalanced Workloads
When one rep covers 14 stores and another covers 6, neither performs well. Unbalanced workloads create burnout on one end and wasted capacity on the other — both hurt field team performance.
Workload balance is a core merchandising KPI that most teams still set by gut feel, not data.
Manual Reporting and Administrative Tasks
Paper forms, redundant check-ins, and manual photo uploads steal time that belongs on the floor. Reps filling out clipboards in parking lots aren’t improving shelf compliance — they’re feeding a broken process.
Retail field execution tools that automate reporting can recover hours every week per rep — hours that go directly back into productive store time.
Incomplete Visits and Repeat Work
A visit without clear task instructions often ends with half the work done. Reps return to fix what was missed — and that repeat visit costs twice the time for the same shelf outcome.
Unclear planograms and last-minute task changes are the two most common causes of incomplete visits in retail field execution.
Limited Field Visibility
When managers can’t see what’s happening in real time, they react instead of prevent. Reactive management creates a cycle of firefighting that kills any chance of consistent merchandiser productivity tracking.
Teams with live field visibility catch execution gaps the same day — not at the end-of-week report (Bfi Uchicago found that active manager oversight directly lifts retail team output).
According to Bls, productivity gaps in field-based roles widen by up to 23% when supervisory feedback is delayed beyond 24 hours.
📊 By the Numbers
Reps can lose 30–40% of their workday to admin tasks before touching a single shelf.
Every one of these drains has a fix — and none of them require hiring better people or pushing reps to work harder. The real question is whether your system is designed to remove friction or quietly create it.
Conclusion
Systems failure — not rep effort — is the real drag on field merchandiser productivity. Fix the system first. The numbers follow.
Retail teams that track merchandiser visit frequency alongside compliance rates consistently beat those that don’t. According to Retailnext, retail workforce productivity drops by up to 20% when teams lack real-time performance visibility.
Most managers blame reps when execution slips. But the root cause is almost always unclear instructions, last-minute task changes, or paper reporting eating 30–40% of the workday.
That is a systems problem. It has a systems fix.