✦ Key Takeaways
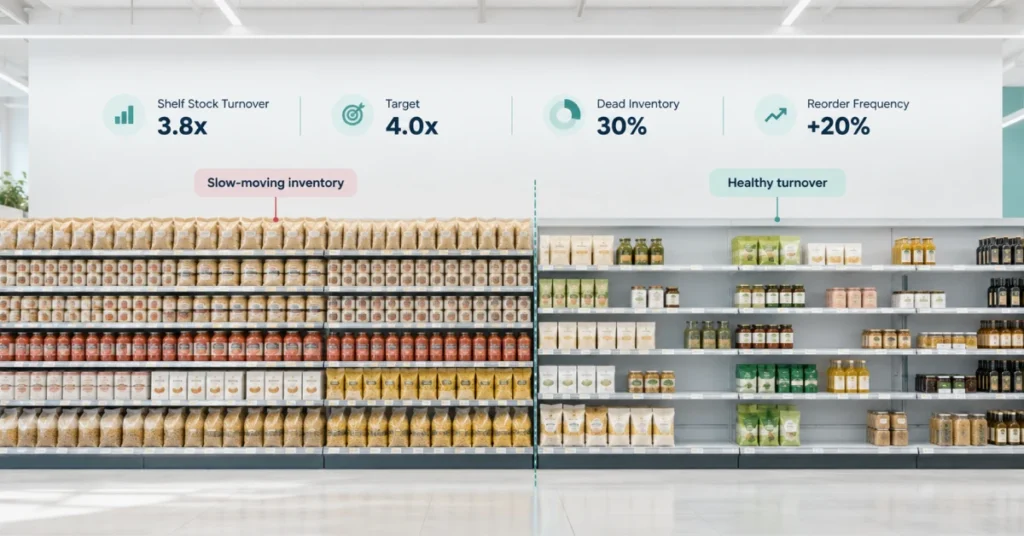
Retailers with a shelf stock turnover rate below 4x annually lose up to 30% of potential revenue to dead inventory.
→ Low turnover locks cash in unsold products, strangling cash flow.
→ Turnover rate reveals which products earn shelf space and which waste it.
→ Raising reorder frequency by 20% can double your turnover rate fast.
In this article:
What Is Shelf Stock Turnover Rate?
How to Calculate Shelf Stock Turnover
What Causes Low Shelf Stock Turnover?
Key takeaway: Your shelf stock turnover rate is the single clearest signal of whether your inventory strategy is working.
What Is Shelf Stock Turnover Rate?
Most retailers watch products sit on shelves and blame the season, the price, or bad luck. The real problem usually starts months earlier — in the buying decision.
The shelf stock turnover rate measures how many times a product sells through and gets replaced within a set period. Think of it as a report card on every inventory call you made before that item ever touched a shelf.
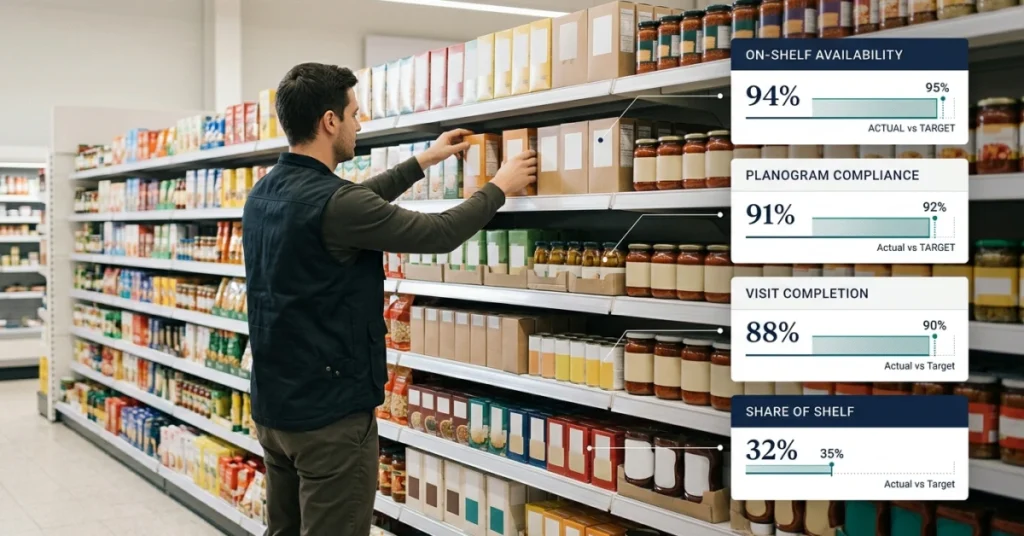
Retailers with strong shelf execution practices consistently hit higher velocity — because the right product, priced right, in the right spot, moves faster.
Shelf Stock Turnover vs. Inventory Turnover
Inventory turnover tracks your entire stock across a warehouse or business. Shelf stock turnover zooms in on what’s actually selling at the store-floor level — where customers decide.
That distinction matters. A product can look fine in your warehouse numbers but sit dead on the shelf for weeks.
How Shelf Turnover Affects Retail Performance
Sluggish sell-through ties up cash, wastes shelf space, and quietly erodes margin. The average U.S. retailer carries roughly 10–15% excess inventory at any given time (Investopedia), which is dead money sitting in plain sight.
Strong product velocity signals that your buying judgment was right — the item fit the customer, the quantity made sense, and the timing landed.
The Relationship Between Turnover and On-Shelf Availability
Product velocity and availability pull in opposite directions when poorly managed. Push sell-through too hard without restocking discipline, and you get empty shelves — which Netsuite notes can cost retailers up to 4% of annual sales in lost revenue from stockouts alone.
The goal isn’t maximum churn — it’s the right replenishment cadence that keeps shelves full and cash moving.
Before you can optimize your stock performance, you need to know exactly how to measure it.
That number reveals more about your business than most owners expect.
How to Calculate Shelf Stock Turnover
Smarter purchasing sets the stage — but the formula tells you how well you played it. The shelf stock turnover rate is calculated by dividing the cost of goods sold (COGS) by average inventory value.
Think of it as a scorecard that grades every buying call you made before the product hit the shelf. A score of 4 means you cycled through your entire inventory four times in a year.
📊 By the Numbers
Retailers with a turnover ratio below 4 tie up 30% more capital in slow-moving stock than high-performers.
Shelf Stock Turnover Formula and Example
The formula is simple: Turnover Rate = COGS ÷ Average Inventory Value. If your COGS is $120,000 and your average inventory is $30,000, your stock turn rate is 4.
That number is not just arithmetic — it shows whether your shelves are working or just holding product hostage. A low result means capital is sitting still instead of generating revenue.
Key Metrics for Measuring Shelf Performance
Turnover alone does not reveal the full picture. Pair it with sell-through rate and days on shelf to get a complete view.
Sell-through rate shows what percentage of received stock actually sold within a set period. Tracking shelf label accuracy alongside these figures catches execution gaps that distort your numbers at the store level.
Bad labels mean lost sales that look like slow turns.
Measuring Turnover by SKU, Category, and Location
A store-wide average hides the real story. One fast-moving SKU can mask a dozen dead ones.
Break your inventory turnover ratio down by product, category, and shelf location to see exactly where stock stalls. The biggest gains almost always live inside a specific category or aisle, not across the whole store.
Granular data is where the real decisions get made.
Setting Turnover Targets for Different Products
Grocery staples should turn 12–15 times per year. Seasonal items may only hit 2–3 turns (Alexanderjarvis).
Applying one universal target across all categories is one of the most common — and costly — mistakes retailers make. Research published by Mdpi confirms that category-specific benchmarks drive more accurate replenishment decisions than store-wide averages.
Set targets by product type, not by gut feel. Once you can segment your results, the next question becomes urgent: why is your rate low, and what decision caused it?
What Causes Low Shelf Stock Turnover?
That score below 4 doesn’t appear by accident — it traces back to specific decisions made long before a product reached the shelf. Most store owners blame slow seasons or bad luck, but the real culprits are upstream choices about what to buy, how much to order, and where to put it.
A weak shelf stock turnover rate is your inventory strategy confessing its mistakes out loud. Once you know which mistake caused the low score, you can fix it — and that’s exactly what each root cause below reveals.
Excess Stock and Slow-Moving Products
Ordering too much of a product that sells slowly is the fastest way to crush your inventory turnover ratio. Dead stock ties up cash and shelf space that faster-moving items could use instead.
Retailers lose an average of 3.2% of annual revenue to excess and obsolete inventory (Tompkinsrobotics). That’s money sitting on a shelf, not working for your business.
Poor Shelf Placement and Product Visibility
A product buried on the bottom shelf sells slower than the same product placed at eye level — location directly affects how fast stock moves. Poor placement quietly lowers your stock rotation strategy without triggering any obvious alarm.
Shoppers make most purchase decisions in seconds. If they can’t see it, they won’t buy it — and your turnover score takes the hit.
Incorrect Assortment and Demand Forecasting
Stocking the wrong product mix is a buying judgment error — not a sales problem. When your assortment doesn’t match what your customers actually want, products sit and your stock turn rate stalls.
Demand forecasting errors are one of the top drivers of low inventory turnover optimization failures, according to Fiixsoftware. Better data at the buying stage fixes the problem before it starts.
Inefficient Shelf Replenishment
Even fast-selling products fail to move if shelves stay empty during peak hours. Slow replenishment creates phantom stockouts — customers leave empty-handed, and your sales data looks worse than reality.
Fixing replenishment timing is one of the quickest wins for stores trying to optimize inventory turnover. It costs nothing to change a schedule, but it can move your ratio fast.
Seasonal Demand and Promotional Changes
Buying for peak season and then missing the window leaves you with shelves full of products nobody wants anymore. Seasonal misalignment is a timing failure — and it shows up directly in a falling shelf stock turnover rate.
Promotions can spike demand fast, but only if stock levels are ready to meet it. Without a plan, a promotion creates a stockout, not a sales win.
📊 By the Numbers
Retailers lose up to 3.2% of annual revenue to excess and slow-moving inventory sitting on shelves.
Every cause above points to the same truth: low turnover is a decision problem, not a market problem — and that means it’s fully within your power to fix it.
Conclusion
Those upstream buying and placement mistakes don’t fix themselves. Every week of slow movement costs you real cash tied up in dead stock.
Retailers who treat their shelf stock turnover rate as a live decision signal catch mistakes before they compound. A quarterly report is already too late.
The math is simple: most retailers lose 20–30% of potential revenue to overstock and poor placement. Those losses happen before a single unit sells, according to Netsuite.
Tracking your first-pass audit rate alongside your stock turn rate gives you the clearest picture. You’ll see exactly where execution breaks down.
Poor shelf visibility is the silent killer of inventory turnover. You can’t fix what your team can’t see in real time.
FieldPie captures live shelf data through photo-based reporting and custom audit forms. That means buying and placement decisions are based on what’s actually on the floor.