


On-shelf availability (OSA) measures the percentage of products that are physically present and purchasable on a retail shelf at the exact moment a shopper reaches for them. Poor OSA directly drives lost sales, erodes brand trust, and pushes consumers toward competitors — often permanently.
What Is On-Shelf Availability — and Why Does It Cost Retailers Billions?
On-shelf availability is the metric that tells you whether the right product is in the right place at the right time. According to the ECR Europe Optimal Shelf Availability report, out-of-stock rates across European retailers average 8.3%, meaning roughly 1 in every 12 SKUs is unavailable when a shopper needs it. For a mid-size grocery chain, that translates to millions in annual lost revenue.
The business case for fixing OSA is straightforward:
- Lost sales: When consumers encounter an out-of-stock item, 31% buy a different brand and 26% leave the store entirely.
- Brand switching: Repeat out-of-stock experiences accelerate permanent brand switching — especially in fast-moving consumer goods (FMCG) categories.
- Retailer trust: Shoppers associate empty shelves with poor store management, not supply chain complexity.
Improving how to improve on-shelf availability starts with understanding exactly why gaps occur.
What Are the Root Causes of Out-of-Stock Events?
Before deploying any fix, brands and retailers must diagnose the source of the problem. The ECR Europe study identifies three primary failure zones:
| Root Cause Category | Contribution to OOS | Example |
|---|---|---|
| Store ordering & replenishment | ~52% | Inaccurate auto-replenishment triggers |
| Shelf replenishment execution | ~25% | Stock in backroom, not on shelf |
| Supply chain & distribution | ~23% | Late deliveries, DC stockouts |
This breakdown is critical. Most out-of-stock events are not supply chain failures — they happen inside the four walls of the store. That means the biggest OSA gains come from improving store-level processes, not just upstream logistics.
What Makes Store-Level Execution So Difficult?
- Mismatched planogram compliance leads to phantom inventory — the system shows stock, but it’s misplaced or buried in the backroom.
- High staff turnover in retail means replenishment training is inconsistently applied.
- Manual shelf audits are slow, subjective, and typically cover each location only once per week.
- Promotional uplift is frequently underestimated, causing stockouts during the exact windows when consumer demand peaks.

How to Improve On-Shelf Availability: 8 Proven Strategies
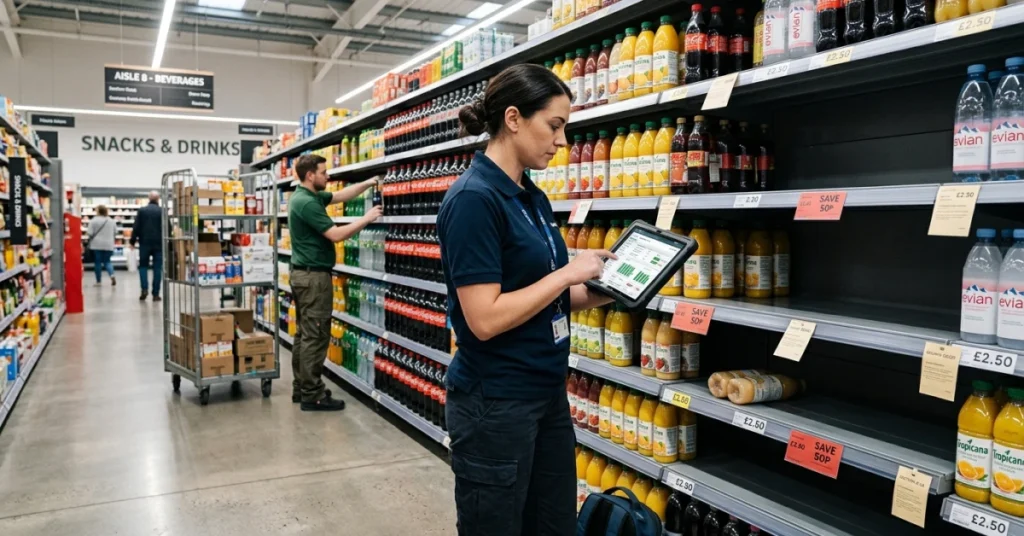
1. Shift From Periodic Audits to Real-Time Shelf Monitoring
Traditional manual audits catch problems after the fact. Real-time shelf monitoring — using computer vision cameras, electronic shelf labels, or handheld scanning — flags out-of-stock conditions the moment they occur.
Retailers deploying real-time shelf intelligence have reduced OSA gaps by up to 30%, because store associates receive immediate, prioritized task alerts rather than end-of-day exception reports.
To help your team move toward real-time visibility, consider integrating a field execution platform that tracks shelf compliance directly from the store floor.
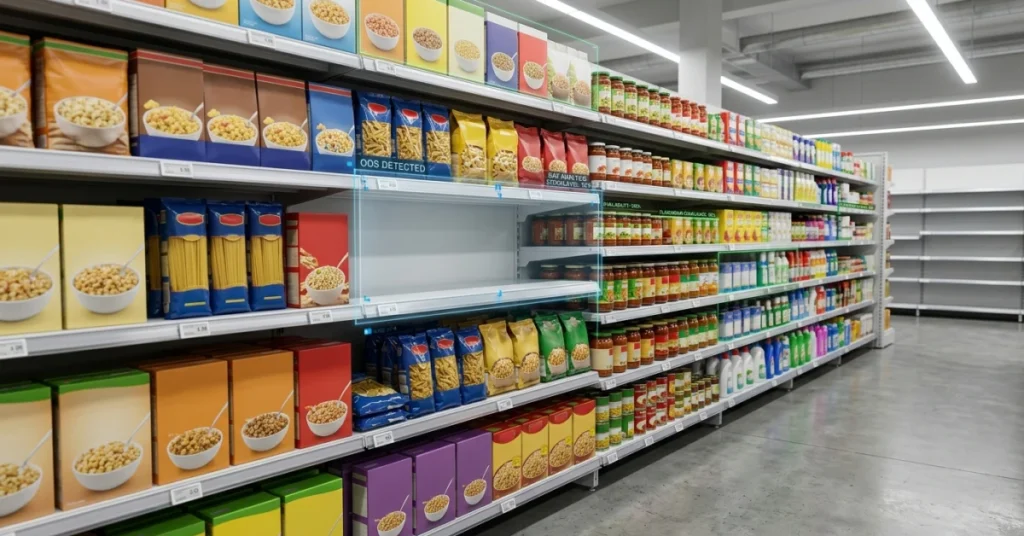
2. Fix Phantom Inventory Before It Destroys Your OSA Metrics
Phantom inventory — where a system shows positive stock but shelves are empty — is one of the most damaging and underreported OSA problems. It tricks replenishment systems into not ordering, creating silent stockouts that persist for days.
Fixes include:
- Regular cycle counts focused on high-velocity SKUs
- Barcode scanning at the shelf level to reconcile system vs. physical inventory
- RFID tagging for high-value or high-shrink categories
- Automated discrepancy alerts when POS velocity and inventory levels diverge
3. Align Replenishment Triggers With Real Demand
Static reorder points based on average weekly sales fail during promotions, seasonal spikes, or local events. Replenishment triggers must incorporate:
- Promotional calendars: System should auto-adjust safety stock 48–72 hours before a promotion goes live.
- Velocity-based thresholds: Fast-selling SKUs need tighter reorder points than slow movers.
- Daypart replenishment: High-traffic morning windows require shelf checks before the store opens, not mid-afternoon.
CPG brands that have integrated demand-sensing data directly into their replenishment system have seen OSA improvements of 5–15 percentage points, depending on category volatility.
4. Enforce Planogram Compliance at Every Store Visit
A planogram that exists only on paper delivers zero OSA benefit. Compliance must be verified, documented, and corrected on every field visit.
Key execution standards:
- Shelf facings match the approved planogram for each SKU
- Shelf-ready packaging is correctly assembled and positioned
- Promotional displays are placed at the agreed location and within the agreed date range
- Out-of-stock positions are reported with a root cause, not just flagged
For brands managing large field teams, linking planogram audits to a structured retail audit workflow ensures data flows back to headquarters in real time rather than sitting in a paper form.
5. Leverage AI-Powered Image Recognition for Shelf Audits
Image recognition technology allows a field rep or in-store camera to photograph a shelf and instantly receive a compliance score — detecting stockouts, wrong facings, and misplaced SKUs in seconds. This technology:
- Reduces audit time per store by 60–80% versus manual methods
- Eliminates subjectivity and inter-rater variability
- Creates a timestamped, photographic audit trail for every SKU
Vusion’s computer vision platform demonstrates how AI-driven shelf intelligence can be deployed at scale across hundreds of store locations, delivering consistent OSA measurement that manual processes simply cannot match.
6. Improve Retailer-Supplier Collaboration on OSA Data
OSA is a shared problem. Retailers hold POS data; suppliers hold demand forecasts and promotional plans. When these data streams remain siloed, both parties make suboptimal decisions.
Best practices for collaborative OSA management:
- Share weekly OSA scorecards broken down by store, category, and SKU
- Establish joint OSA targets with financial accountability on both sides
- Use vendor-managed inventory (VMI) for top-selling SKUs in high-volume accounts
- Conduct quarterly joint business reviews with OSA as a standing agenda item
7. Train and Incentivize Store Staff on OSA Metrics
Store associates are the last line of defense against empty shelves. If they don’t understand what OSA means or why it matters, execution suffers regardless of how sophisticated your technology stack is.
Effective training programs:
- Tie replenishment task completion to shift performance metrics
- Use mobile-first task management apps so associates receive, complete, and confirm shelf tasks in real time
- Recognize top-performing stores in internal communications to build competitive accountability
- Refresh OSA training quarterly — not just during onboarding
8. Use FieldPie to Close the Execution Gap
Technology strategies only work if field teams can act on the data they generate. FieldPie is a field operations platform purpose-built to help brands and retailers eliminate the gap between what the OSA system detects and what actually gets fixed on the shelf.
With FieldPie, field reps receive prioritized task lists based on real-time OSA alerts, complete photo-verified shelf audits, and submit structured reports that flow directly into management dashboards. Regional managers gain immediate visibility into which stores have unresolved stockout issues and which reps are completing tasks on time.
For teams managing dozens or hundreds of store visits per week, using FieldPie to streamline your retail execution workflow eliminates the reporting lag that lets out-of-stock conditions persist for hours or days after they’re detected.
How Do You Measure On-Shelf Availability Accurately?
OSA is typically expressed as a percentage:
OSA % = (Number of SKUs in stock at point of measurement ÷ Total SKUs listed) × 100
However, the measurement method matters enormously. Common approaches include:
- Manual shelf audits: Low cost, but infrequent and subjective. Suitable for small store counts.
- POS-based inference: Uses sales velocity to infer stockouts when sales drop unexpectedly. Fast and scalable, but indirect.
- Computer vision / image recognition: Highest accuracy and frequency, but requires hardware or field app investment.
- RFID / electronic shelf labels: Near-continuous monitoring with automated alerts; best for high-value or high-velocity categories.
Most enterprise retailers use a combination of POS-based inference for broad coverage and image recognition for their most critical SKUs and accounts. For brands managing field teams, integrating OSA measurement into your store visit reporting creates a unified data layer that connects field observations to replenishment decisions.
According to Scandit’s analysis of the OSA gap, retailers that move from weekly manual audits to daily technology-assisted checks reduce their average out-of-stock duration by more than 50% — a gain that translates directly to recovered sales.
What Does Good OSA Performance Actually Look Like?
Industry benchmarks vary by category, but general standards are:
| Performance Level | OSA Rate | Implication |
|---|---|---|
| World-class | 98–99% | Best-in-class CPG/retail partnerships |
| Good | 95–97% | Competitive, manageable OOS rate |
| Average | 92–94% | Significant sales leakage; improvement needed |
| Poor | Below 92% | Systematic execution or supply chain failure |
For high-velocity categories like carbonated beverages, snacks, or household essentials, even a 95% OSA rate means 1 in 20 shopping trips ends in a missed sale. The standard in these categories should be 98%+.
CPG brands can benchmark their OSA performance against category norms by reviewing the Kaizen Institute’s retail availability framework, which outlines the operational levers most effective at closing the gap between current and target OSA rates.
How Does Poor OSA Affect the Shopping Experience?
The consumer impact of out-of-stock events extends well beyond a single lost transaction. Research from ECR Europe shows that when shoppers encounter an out-of-stock item:
- 9% postpone the purchase — a deferred sale that may never return
- 26% leave the store without buying a substitute
- 31% buy a competing brand — often discovering they prefer it
For brands, the second and third outcomes are existential. A consumer who switches brands during a stockout and has a positive experience with the substitute is unlikely to switch back. This is why OSA is not just an operational metric — it is a brand equity metric.

Conclusion
Empty shelves are not inevitable. The tools, processes, and data infrastructure to achieve 97–99% OSA exist today — and the brands and retailers reaching those levels share a common set of practices: real-time monitoring, disciplined field execution, phantom inventory elimination, and tight retailer-supplier collaboration.
The path to improving how to improve on-shelf availability runs through your field team’s daily actions as much as your technology stack. A sophisticated shelf intelligence platform that feeds alerts to a field team with no structured workflow is only half a solution. The other half is ensuring every alert triggers a completed, verified, documented action — at the right store, within the right time window.
Frequently Asked Questions (FAQ)
What is a good on-shelf availability rate?
A world-class OSA rate is 98–99%. Most competitive retailers and CPG brands target 95–97% as a minimum acceptable threshold. Rates below 92% indicate systemic execution or supply chain problems that require immediate corrective action.
What is the difference between OSA and OOS?
OSA (on-shelf availability) measures the percentage of listed SKUs that are present and purchasable on the shelf at a given moment. OOS (out-of-stock) is the inverse — the percentage of SKUs that are unavailable. An OSA of 95% equals a 5% out-of-stock rate. Both metrics describe the same condition from opposite perspectives.
How often should shelf audits be conducted?
For high-velocity SKUs and key accounts, daily or near-real-time monitoring is the standard. For lower-velocity items in secondary accounts, weekly audits are acceptable. The frequency should match the replenishment cycle and the sales velocity of the category — faster-moving products need more frequent checks to catch stockouts before they compound into significant sales losses.


