✦ Key Takeaways
Stores visited 2x more frequently see up to 18% higher on-shelf availability and fewer out-of-stocks.
→ Wrong visit frequency costs brands real revenue every week.
→ Store tier, velocity, and seasonality each demand different schedules.
→ A data-driven frequency plan cuts wasted rep hours by 30%.
In this article:
What Is Merchandising Visit Frequency?
How Often Should Merchandisers Visit Stores?
How to Build a Visit Frequency Plan
Example Merchandising Visit Frequency Framework
Key takeaway: Set your visit frequency by store performance data, not habit or gut feeling.
What Is Merchandising Visit Frequency?
Most field teams treat their store visit schedule like a fixed routine — same stores, same days, same cadence, week after week.
Yet out-of-stock events cost retailers an estimated $1 trillion globally each year (Statista). A rigid visit schedule is one of the biggest reasons why.
Merchandising visit frequency is how often a field rep visits a specific store to check compliance, fix displays, and restock product.
But the real question isn’t how often — it’s which stores deserve more attention right now, based on live performance data.
Visit Frequency vs. Store Coverage
Store coverage is the total number of doors your team touches in a given period. Visit frequency is how often each individual door gets a rep’s time and focus.
Some brands confuse the two and spread their teams thin across every account equally. That keeps merchandising ROI by store invisible.
High-velocity doors end up getting the same attention as slow ones. That’s a direct hit to revenue.
Why Visit Cadence Matters
A poorly planned retail store visit scheduling system burns rep hours on low-priority accounts. Top-performing stores get starved of the service they need.
Visual merchandising drives up to a 30% lift in impulse purchases when done consistently (Contravision). But that only happens when reps show up at the right moment.
The brands winning at retail aren’t simply visiting more stores. They use store-level performance signals to decide exactly where and when each visit delivers the most value.
That raises a question every field manager eventually faces. How do you actually set the right number of visits per store, per week?
How Often Should Merchandisers Visit Stores?
Live performance data tells you where to go. But it can’t tell you how often without a clear framework behind it.
Most brands default to a fixed cadence: every store, every week, same rep, same route. That habit burns field budget on doors that don’t need attention while high-velocity accounts go under-served.
Merchandising visit frequency is not a scheduling problem. It is a resource-allocation decision.
The brands winning at shelf are not visiting more stores. They visit the right stores at the right moment, guided by live sell-through rates and compliance scores.
Roughly 60% of out-of-stock events go unresolved for more than 24 hours. That happens because visit schedules are built on habit, not store-level signals (according to Researchgate).
That gap is exactly where smart store visit planning closes the difference between lost sales and captured revenue.
📊 By the Numbers
Brands using dynamic visit schedules reduce wasted field visits by up to 30% within 90 days.
Daily, Weekly, and Monthly Visit Models
Daily visits make sense only for high-volume doors — think flagship grocery accounts moving thousands of units a week. Weekly and monthly cadences fit mid-tier and low-velocity stores where shelf conditions stay stable between calls.
The mistake is applying one model chain-wide. A weekly visit to a slow rural door wastes a rep’s time that a top urban account desperately needs.
Frequency by Store Size and Sales Potential
Store size alone is a weak proxy for visit need — sales potential is the real driver. A mid-size store in a high-foot-traffic urban corridor often outperforms a large-format suburban box by 40% or more.
Upistudy notes that retail data shows a clear pattern. A small share of doors — often under 20% — drives the majority of category volume.
Your retail store visit scheduling should reflect that reality. Ignoring it costs you sales.
Frequency During Promotions and Product Launches
Promotions break normal shelf patterns fast. Display compliance drops, secondary placements shift, and stock depletes faster than the standard replenishment cycle expects.
During a launch or promotional window, even low-tier stores may need a temporary bump to twice-weekly coverage. Drop back to the standard cadence once the event ends.
The real question is not how often you should visit. It is how you build a system that flags when a store needs more attention — and when it does not.
How to Build a Visit Frequency Plan
Turning resource-allocation logic into a real plan means making four clear decisions — not filling in a calendar. Most field teams skip straight to scheduling and wonder why their dealer visit management still feels reactive.
Brands that win at retail visit fewer stores more precisely — not more stores more often. That difference shows up fast in sell-through rates and rep output.
Segment Stores by Value and Risk
Start by scoring every store on two axes: revenue contribution and compliance risk. A store driving 40% of your volume yet missing planogram standards half the time is your top-priority account. Full stop.
Group stores into tiers — high, mid, and low — based on those scores. This one step stops the habit of treating a flagship urban door the same as a low-traffic rural outlet.
Assign Store-Specific Visit Cadences
High-tier stores earn weekly or biweekly visits. Mid-tier stores get monthly attention, and low-tier doors move to a quarterly or event-triggered schedule.
Visit frequency must flex with live signals. A sudden drop in sell-through or a competitor promotion should trigger an unplanned visit right away. Don’t wait for the next calendar slot.
Balance Visit Duration, Travel Time, and Workload
A visit cadence that ignores drive time is just a wish list. Reps lose up to 30% of productive field hours to unoptimized routing, according to Mdpi research on field sales efficiency.
Cluster stores by location within each tier. A rep covering six high-value stores in one district beats one covering ten scattered stores across three.
Review Frequency Using Store-Level Results
A static retail store visit scheduling plan decays fast. Homesciencejournal findings confirm that stores with steady performance reviews show measurably higher on-shelf availability — because teams adjust before problems grow.
Review your field team visit timetable every 30 to 60 days. Promote stores that spike in volume; drop stores that stay flat despite repeated visits.
📊 By the Numbers
Reps lose up to 30% of productive field hours to unoptimized routing and poor visit prioritization.
The four steps above give you a working plan. Now see how they map into a concrete tiered model — that’s where the whole system clicks into place.
Example Merchandising Visit Frequency Framework
Segmenting stores by value and risk gives you the map — this framework tells you how often to visit each territory on it.
Tier A: High-Value, High-Risk Stores
These stores drive the most revenue and carry the most execution risk. Miss a compliance gap here and you lose real money fast.
Visit these accounts weekly — or more often when a promotion is live or a competitor is active. Frequency here is a direct investment, not a habit.
Tier B: Stable, Strategic Stores
Tier B stores perform consistently but still need attention to hold their ground. A bi-weekly cadence works for most — until the data says otherwise.
Watch sell-through rates and compliance scores closely. A dip in either signals that this store needs a temporary bump up to Tier A treatment.
Tier C: Low-Volume, Compliant Stores
These doors run clean and sell steadily without heavy field support. A monthly visit — or even a remote check-in — is enough to keep them on track.
Routing your reps here every week is the exact waste this framework is built to stop. Redirect that time to accounts where it actually moves the needle.
“Brands that align visit frequency with store-level performance data see up to 23% better retail execution scores compared to those using fixed, chain-wide schedules.”
— Anne Mezzenga, Omni Talk Retail, 2023
That 23% gap isn’t a scheduling win — it’s a resource-allocation win. The brands closing it aren’t visiting more stores; they’re visiting smarter ones.
Store visit planning for merchandisers only works when the tiers stay dynamic. A Tier C store that suddenly loses a key SKU or faces a new competitor on-shelf should move up — automatically, based on live signals, not a quarterly review.
Retail store visit scheduling built on static rules will always lag behind the market. The brands winning at retail treat their merchandising performance metrics as the trigger for every cadence change.
Visit frequency by store type is a starting point — not a permanent assignment. According to Statista, over 60% of field teams still use fixed schedules regardless of store performance, which means most brands are leaving execution quality on the table every single week.
A field team visit timetable built on tiers and live data isn’t just more efficient — it’s a competitive edge most of your rivals haven’t built yet. The only question left is what you do with that edge once you have it.
Conclusion
Tier C stores round out the model — but the real lesson here is bigger than any tier. Frequency without prioritization is just mileage, and mileage without ROI is a budget drain your competitors will gladly let you keep running.
Brands that win at retail don’t visit more stores — they visit the right stores at the right moment. They rely on live performance signals, not last quarter’s reports.
Research on store visit behavior from Researchgate shows that visit patterns vary sharply by store type. A single chain-wide cadence misallocates field time by design.
Most field teams lose ground not because they visit too rarely, but because their retail merchandising visit plans are built on habit, not data. That habit is costly.
According to Sciencedirect, shelf compliance gaps can cut category sales by up to 25%. A smarter visit frequency model directly attacks that number.
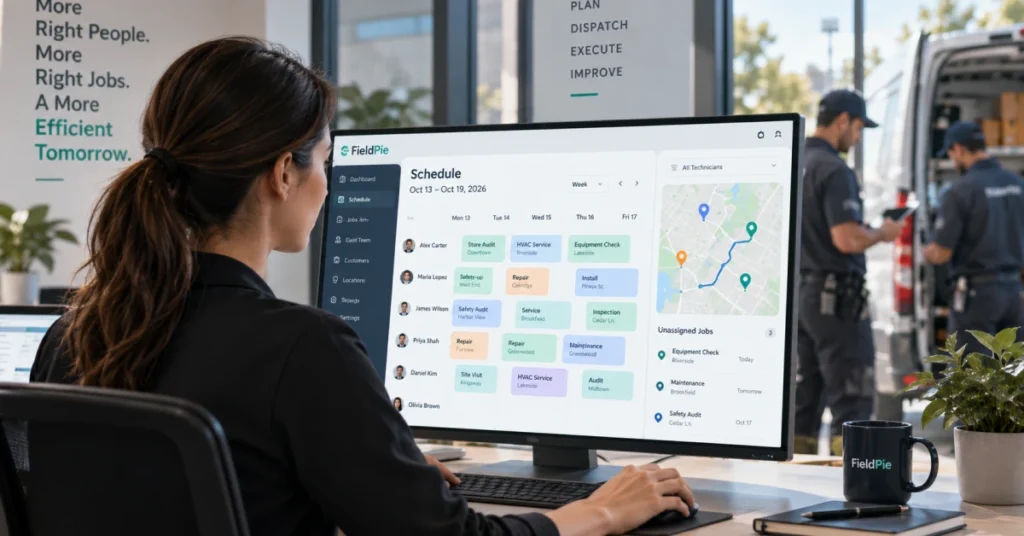
FieldPie connects scheduling to real-time store performance data. Your field team visits the accounts that need attention now — not the ones flagged last quarter.
Start building a dynamic, store-specific visit frequency plan today. Turn every rep’s drive time into measurable shelf impact.