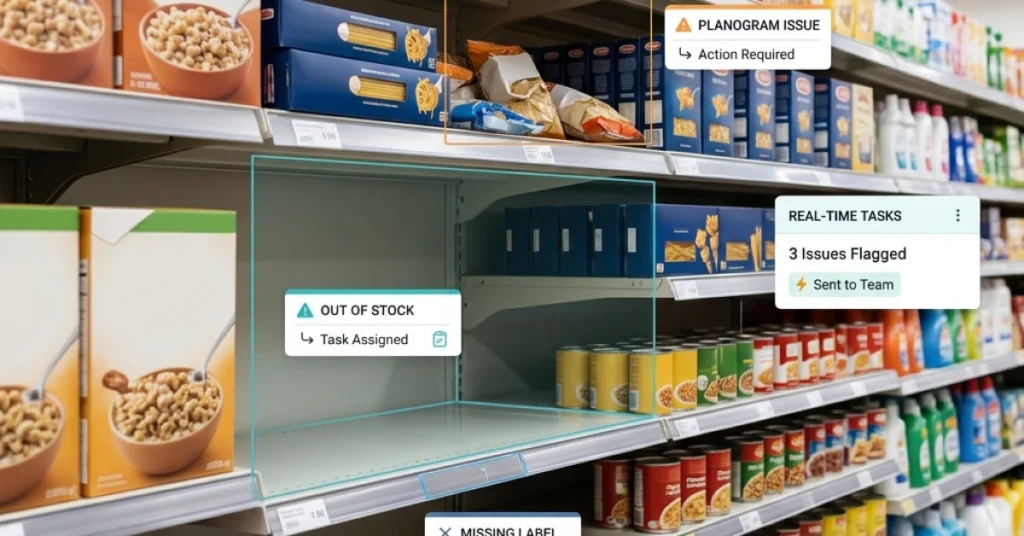
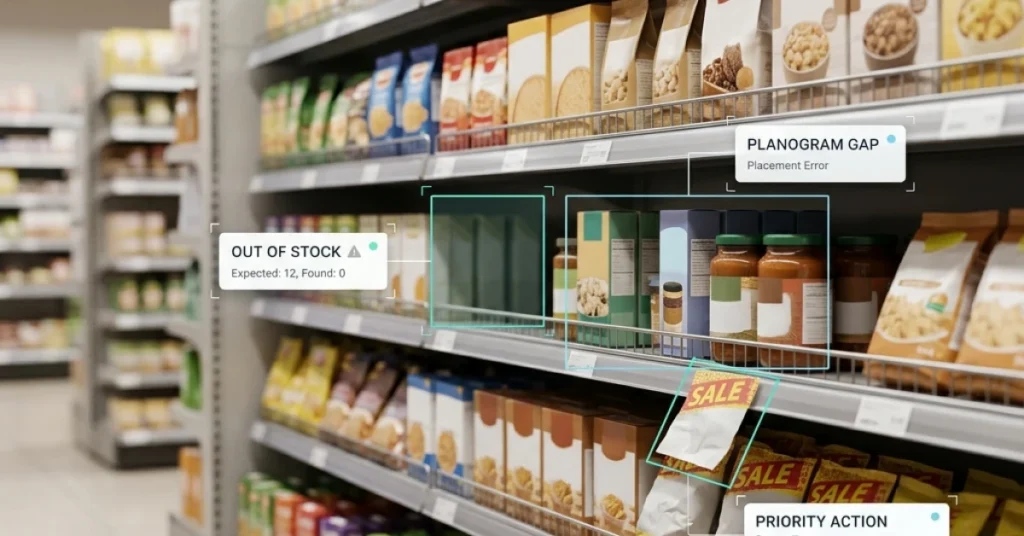
Your planogram calls for three facings of a product. During a store visit, your merchandiser finds two. How do you record the difference, decide what caused it, and verify that it was fixed?
That’s what planogram compliance helps you measure. It connects your retail strategy to what shoppers actually see. This guide explains how to check SKU placement and facings, calculate a compliance score, and follow shelf issues through to verified correction.
What Is Planogram Compliance
Planogram compliance measures how closely a store’s actual shelf layout matches the approved planogram for that location. A shelf audit typically checks whether each SKU is in its assigned position and whether it has the planned number of facings. A facing is one unit of a product visible at the front of the shelf.
For example, a SKU can be in the correct position and still fall short of the planogram if it has two facings instead of three. Record the facing shortfall separately from its cause. The team may need to replenish the shelf, move a neighboring product, or flag a stock issue.
Track on-shelf availability and promotional setup separately when they have their own audit criteria. This makes it easier to tell whether a low score reflects a layout issue, missing stock, or a promotion that wasn’t installed.
How to Measure Planogram Compliance in 5 Steps
- Select the approved planogram. Confirm the store, shelf section, and planogram version before the visit. Use the layout assigned to that location and store format.
- Check SKU placement and facings. Compare each audited SKU with its assigned shelf position and count the units visible at the front. Record placement and facing count as separate checks.
- Capture photo evidence. Take a clear photo of the audited shelf section and attach it to the visit record. Note which SKU failed, what the planogram called for, and what the merchandiser found.
- Calculate the compliance rate. Divide the number of passed checks by the total number of completed checks, then multiply by 100. Record skipped checks separately so the score can be read alongside audit coverage.
- Assign and verify the correction. Give each issue an owner and a due date. After the fix, review a new photo or recheck the shelf before closing the task.
Planogram Compliance Calculation Example
A merchandiser checks 10 SKUs. For each SKU, they record one check for placement and one for facing count. Of the 20 checks, 18 pass. One SKU is on the wrong shelf, and another has two facings instead of the required three.
Planogram compliance rate = (18 passed checks ÷ 20 completed checks) × 100 = 90%.
The score gives the team a baseline. The two failed checks tell them exactly what to fix.


How FieldPie Helps Teams Verify Planogram Execution
Once the merchandising team approves a layout, FieldPie’s retail workflows help field teams check how it was implemented during store visits. Teams can use geo-located store visits to connect audit results to the right location and capture shelf photos alongside structured findings.
For example, a merchandiser finds two facings where the planogram requires three. They record the expected and actual counts and attach a photo to the visit. A supervisor reviews the finding and assigns the correction. Once the third facing is restored, the team submits a second photo for review before the task is closed.
With real-time retail data, headquarters can review submitted findings across stores and see which corrections still need attention.
What to Look for in Planogram Compliance Software
Bring one of your own planograms to the demo and ask the vendor to walk through a store visit from start to finish. Use a shelf example with a misplaced SKU and an incorrect facing count so you can test how the tool handles both issues.
- Planogram assignment — Can the merchandiser find the approved layout for the correct store and shelf section?
- Photo evidence — Can the team attach a clear shelf photo to the visit and identify which check failed?
- Corrective tasks — Can a supervisor assign the issue to an owner, set a due date, and track progress?
- Verification — Can the reviewer compare the original finding with a new photo before closing the task?

3 Metrics to Track After a Shelf Audit
| Metric | How to measure it | How to use it |
|---|---|---|
| Planogram compliance rate | Passed checks ÷ completed checks × 100 | Compare stores or periods using the same audit criteria. Review failed checks to see which SKUs or shelf sections need attention. |
| Time to verified correction | Time from when an issue is logged to when its correction is verified | Identify where fixes stall. Check whether the delay comes from task assignment, stock availability, or review. |
| Repeat deviation rate | Previously corrected issues that recur ÷ previously corrected issues rechecked × 100 | Identify recurring problems. If the same SKU keeps losing a facing, check replenishment routines, shelf capacity, and layout instructions. |
Turn Planogram Findings Into Verified Fixes
Start with one shelf section and a clearly defined set of checks. Record SKU positions and facing counts, calculate a baseline, and assign each failed check to someone who can resolve it. At the next visit, confirm which issues were fixed and which returned.
Bring one of your existing planograms to a FieldPie demo and walk through the full process, from capturing shelf evidence to verifying a correction.