


✦ Key Takeaways
Poor retail space optimization costs stores up to 20% in lost sales annually.
- → Data-driven layouts directly increase sales per square foot.
- → KPIs like conversion rate reveal hidden space performance gaps.
- → Planogram compliance and traffic flow are non-negotiable optimization levers.
In this article:
- What Are Retail Space Solutions?
- Why Is Retail Space Optimization Critical for Retailers?
- What Are the Core Components of Effective Retail Space Solutions?
- How Do Retailers Use Data to Optimize Retail Space?
- What KPIs Should Retailers Track for Retail Space Performance?
What Are Retail Space Solutions?
Most retailers treat their floor plan as a fixed cost. The ones gaining ground treat every square foot as a revenue-generating asset — one that demands the same rigor as any capital investment.
Retail space optimization is the strategic discipline of aligning physical store layout, fixture placement, and shelf space management to maximize sales per square foot. Done right, it turns store space planning from a one-time setup into a continuously audited system.
Poorly allocated space is a silent margin killer — and most retailers don’t measure it against retail performance benchmarks until the damage is done.
How Retail Space Planning Impacts Sales Performance
Store layout optimization directly shapes customer flow, dwell time, and purchase decisions — all before a single promotion runs. Optimized store layouts can lift sales by up to 15% without adding inventory or headcount (according to Ariadne).
Research from Scholarworks Umass confirms that product adjacency and shelf space management directly influence unplanned purchase rates — the category where margin is actually made. Retailers who ignore these levers aren’t just leaving money on the table — they’re structurally disadvantaged against competitors who don’t.
The real question isn’t whether retail floor planning affects revenue — it’s whether your current approach is measuring that impact at all.
Why Is Retail Space Optimization Critical for Retailers?
Every square foot of floor space is either generating revenue or eroding margin — and merchants who treat their stores as a static backdrop lose a measurable competitive edge. Layout planning isn’t a merchandising afterthought; it’s a capital allocation decision.
Optimized retail performance metrics consistently show that shelf management and store planning directly drive conversion rates and basket size. Operators who audit square footage with financial rigor outperform those who rely on intuition alone.
How Shelf Placement Influences Customer Buying Behavior
Eye-level positioning drives up to 35% more unit sales compared to floor-level placement — a fact most operators chronically underutilize. Strategic shelf management turns passive browsing into active purchasing.
Planogram compliance and adjacency logic aren’t aesthetic choices; they’re revenue levers. Merchants who engineer product placement around buying psychology consistently capture higher margin per facing.
Reducing Dead Zones and Underperforming Areas
Dead zones — low-traffic corners and poorly signed back aisles — silently drain revenue from every store format. Identifying and reallocating these areas is the fastest path to improving yield per square foot.
According to Relexsolutions, operators who actively remap underperforming zones recover an average of 10–20% in previously lost sales capacity. That recovery requires no new inventory — only smarter floor planning.
Improving Customer Flow Through Better Store Layouts
A well-engineered floor plan directly controls how far shoppers travel — and distance traveled correlates strongly with total spend. Think of it as a silent sales associate working every hour the doors are open.
Research published by Mdpi confirms that customer path length and exposure to product categories significantly predict purchase volume. Operators who design for movement — not just aesthetics — convert more browsers into buyers.
Increasing Revenue Per Square Foot
Revenue per square foot is the clearest signal of whether your spatial strategy is working or failing. Treating each zone as an asset class — with defined performance thresholds — forces accountability into every merchandising decision.
Merchants who apply this financial lens to store planning stop tolerating underperforming fixtures and start reallocating footage the way CFOs reallocate capital. The question isn’t whether to act — it’s whether the right components are in place to do it effectively.

What Are the Core Components of Effective Retail Space Solutions?
Applying that analytical rigor starts with having the right structural components in place — without them, even the best data has nowhere to land. Retailers who master store space planning at the component level convert up to 20% more revenue per square foot than those who treat layout as a one-time decision.
Each component below functions as a distinct lever. Pull the wrong one — or ignore it entirely — and your retail display execution suffers regardless of how strong your merchandising strategy looks on paper.
Planogram Management
A planogram is not a suggestion — it is a binding contract between your space strategy and your sales floor. Retailers who enforce planogram compliance consistently report fewer out-of-stocks and higher shelf productivity (Dotactiv).
Planogram discipline ensures that every fixture earns its footprint rather than defaulting to habit or vendor pressure.
Shelf Space Optimization
Shelf space management means allocating facings based on velocity, margin, and category role — not historical habit. Dead facings are dead capital; treat them accordingly.
According to Visiongroupretail, optimized shelf allocation can increase category sales by up to 15% without adding a single SKU.
Product Placement Strategies
Eye-level placement drives disproportionate sales — products positioned at eye level outsell those on bottom shelves by as much as 35%. Placement is not aesthetic; it is a pricing decision expressed in space.
High-margin items belong in high-traffic zones. That single rule, applied consistently, reframes retail floor planning as a revenue allocation exercise.
Visual Merchandising Standards
Visual merchandising standards create the sensory logic that guides shoppers toward conversion. Without enforced standards, even a well-planned store layout optimization breaks down at the fixture level.
Consistency across locations is not a branding nicety — it is a measurable driver of basket size and dwell time.
Category Management and Space Allocation
Category management ties space allocation directly to shopper mission and margin contribution. Dotactiv emphasizes that space must reflect category role — destination, routine, or impulse — not just sales volume.
Retailers who align space allocation to category strategy stop subsidizing low-performing zones with high-traffic adjacencies.
Store Traffic and Heatmap Analysis
Heatmap data reveals which zones shoppers actually visit versus which zones retailers assume they visit. That gap — often significant — is where margin quietly erodes.
Store layout optimization without traffic data is guesswork dressed as strategy. Heatmaps turn assumption into evidence, and evidence into reallocation decisions.
How Do Retailers Use Data to Optimize Retail Space?
Those structural components only create value when retailers treat every square foot as a revenue-generating asset — one that demands continuous measurement, not periodic guesswork. real-time retail data transforms static floor plans into dynamic, self-correcting systems.
Shelf space misallocation costs the average retailer up to 25% in lost sales — not from poor product selection, but from poor space decisions (Dsstream). Retailers who audit space with the same rigor applied to financial capital consistently outperform those who rely on intuition alone.
Using Sales Data to Improve Shelf Allocation
Sales velocity data reveals which products earn their shelf space — and which quietly erode margin. Retailers use this data to reallocate shelf space toward high-turn SKUs and eliminate underperforming placements.
According to Dsstream, optimized shelf space management can increase category sales by up to 30% without adding a single new product. That’s a structural revenue gain driven entirely by smarter store space planning.
Analyzing Customer Traffic Patterns
Foot traffic data exposes dead zones — areas where shoppers rarely go and fixtures generate near-zero return. Retailers use heatmaps and sensor data to redesign retail floor planning around actual movement, not assumed behavior.
Ariadne notes that traffic-informed store layout optimization can increase conversion rates by repositioning high-margin products into high-dwell zones. Space decisions made without traffic data are essentially financial decisions made without a balance sheet.
Measuring Product Visibility and Share of Shelf
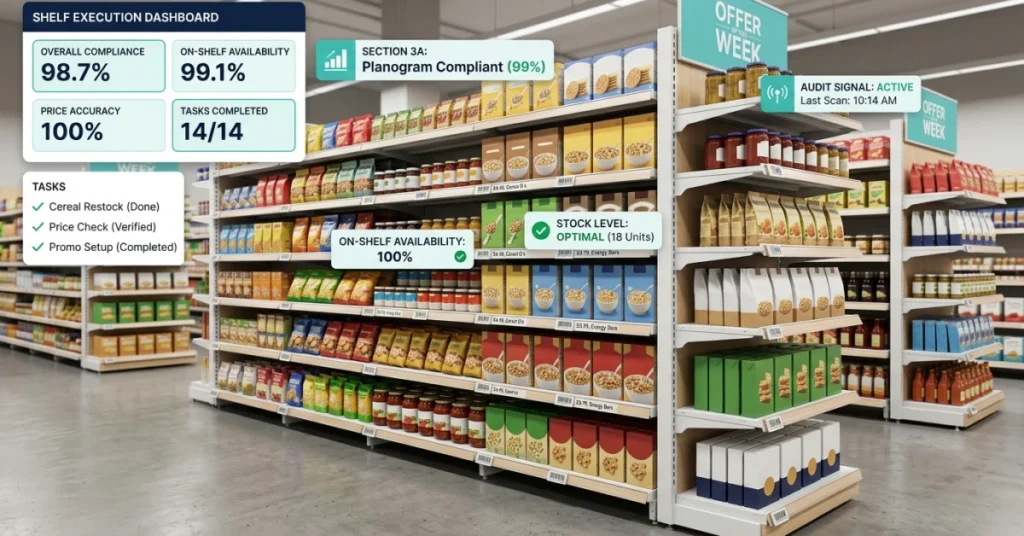
Share of shelf directly correlates with purchase likelihood — products with greater visual presence consistently outsell those buried in secondary positions. Retailers use image recognition and planogram compliance tools to audit visibility at scale.
Retail space optimization fails when planograms exist on paper but not on shelves. Visibility measurement closes that gap between strategy and execution.
Tracking On-Shelf Availability (OSA)
Empty shelves are the most expensive real estate in retail — space that costs money while generating zero revenue. OSA tracking identifies stockout patterns before they compound into measurable sales loss.
Retailers who monitor OSA in real time treat shelf availability as a financial metric, not a logistics afterthought. The question that follows is which specific KPIs actually confirm whether all of this optimization is working — or quietly failing.
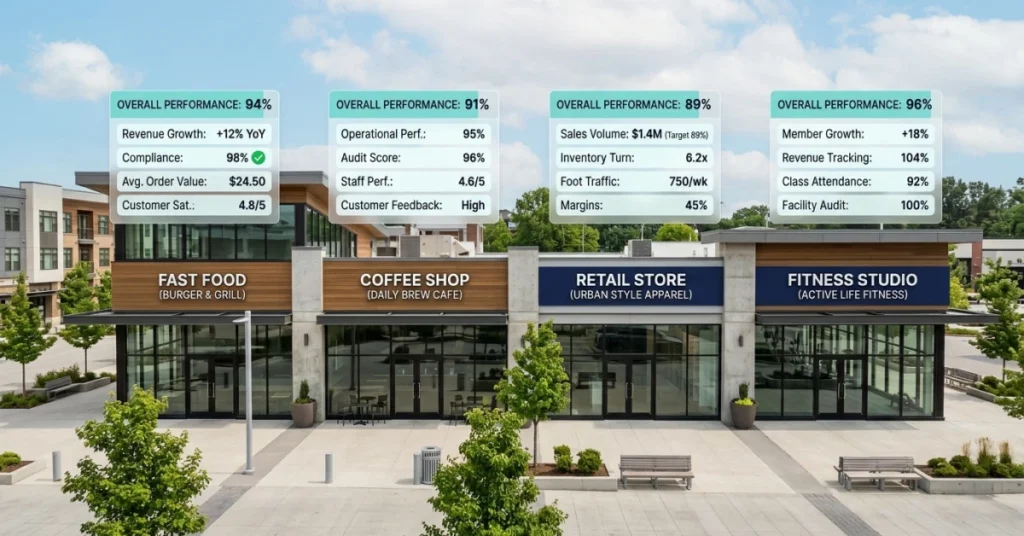
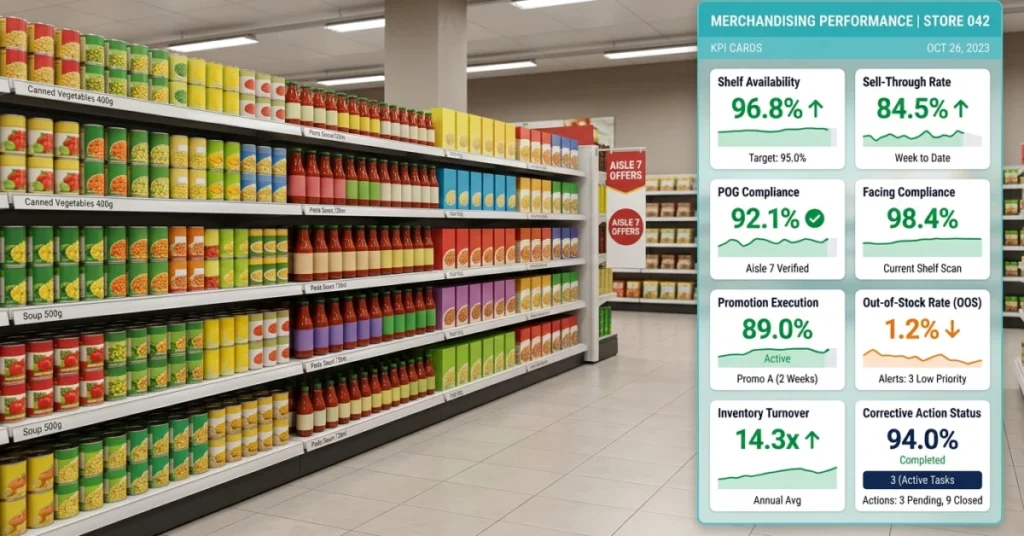
What KPIs Should Retailers Track for Retail Space Performance?
Measuring space as a revenue asset demands the right scoreboard — not vanity metrics, but KPIs that expose exactly where each square foot earns or bleeds margin. Retailers using structured space KPIs report up to 15% higher sales productivity per square foot versus those relying on gut-feel resets.
Tracking the wrong metrics is as costly as tracking nothing. The six KPIs below turn real-time retail data into decisions that compound over every planogram cycle.
Sales Per Square Foot
This is the foundational metric for retail space optimization — it tells you exactly what each zone is earning. According to Linkretail, top-performing retailers generate over $400 in annual sales per square foot, while average performers sit closer to $200.
Any zone consistently underperforming that benchmark is a capital misallocation — not a display problem. Treat it accordingly.
Planogram Compliance Rate
A planogram only drives revenue when it is actually executed in the store. Low compliance rates mean your store layout optimization strategy exists on paper, not on the shelf.
FieldPie captures photo-based compliance audits in real time, giving managers instant visibility into execution gaps across every location — before they erode margin.
On-Shelf Availability Rate
An empty shelf is a guaranteed lost sale — and a silent drag on your sales-per-square-foot number. Out-of-stocks cost retailers an estimated 4% of total sales annually (Relexsolutions).
Shelf space management fails entirely when product isn’t there to fill it. Availability rate must be tracked at the SKU and zone level, not just store-wide.
Product Sell-Through Rate
Sell-through rate reveals whether your store space planning matched actual demand — or just looked good on a reset report. A rate below 80% signals over-allocation of shelf space to slow-moving SKUs.
Reallocating that space to high-velocity products is one of the fastest levers in retail floor planning. It requires no new fixtures — just better data discipline.
Customer Dwell Time
Dwell time measures how long shoppers engage with a zone — a direct proxy for category appeal and fixture effectiveness. Short dwell in a high-margin section signals a merchandising or adjacency failure, not a traffic problem.
Pairing dwell data with conversion rates separates zones that attract attention from zones that actually drive purchase decisions.
Category Performance by Shelf Position
Eye-level placement consistently outperforms floor-level by 30–40% in unit velocity — making shelf position a measurable revenue variable, not a preference. Tracking performance by position turns store layout optimization into a repeatable, evidence-based process.
When these six KPIs are tracked together, every space decision becomes defensible — and every underperforming zone becomes an opportunity waiting for reallocation.
Conclusion
Metrics only create value when retailers act on them — and stores that treat every square foot as a revenue-generating asset consistently outperform those that treat space as a fixed cost. Optimized retail execution strategies close the gap between what data reveals and what the floor actually delivers.
Retailers who apply financial-capital rigor to store space planning see measurable returns: well-optimized shelf space management can lift sales per square foot by up to 30% (Nuqleous). That number compounds across every planogram cycle when store layout optimization is treated as a continuous process, not a seasonal reset.
Most retailers lose margin because floor planning decisions go unaudited between resets — FieldPie captures real-time photo-based field data and customizable audit forms so every space reallocation is verified, not assumed. As Visiongroupretail confirms, continuous space planning discipline separates high-performing retailers from those reacting to lost sales.
Start auditing your floor as a revenue asset — not a layout decision.


