✦ Key Takeaways · 6 min read
Retailers lose up to 4% of annual sales every year due to poor on-shelf availability.
- → Out-of-stocks cost global retailers $1 trillion annually in lost revenue.
- → Phantom inventory—not demand—causes 70% of on-shelf availability failures.
- → AI-powered shelf sensors now detect stockouts in real time, not days later.
In this article:
- What Is Retail On-Shelf Availability?
- Why Is On-Shelf Availability So Important for Retailers?
- What Causes Low On-Shelf Availability in Stores?
- How Do Modern Retailers Track Shelf Availability?
- Which KPIs Matter Most for OSA Performance?
Key takeaway: Fixing on-shelf availability is the single fastest lever retailers have to recover lost sales.
What Is Retail On-Shelf Availability?
Retailers lose an estimated $1 trillion annually to poor on-shelf availability — yet most of that loss isn’t a supply chain failure. It’s product sitting in the back room, miscounted in the system, or blocked by a misplaced facing that no shopper can reach.
OSA retail measures the percentage of time a product is physically accessible and purchasable by a shopper on the shelf. That last word — purchasable — is where most shelf availability metrics quietly break down.
What OSA Really Means in Daily Retail Operations
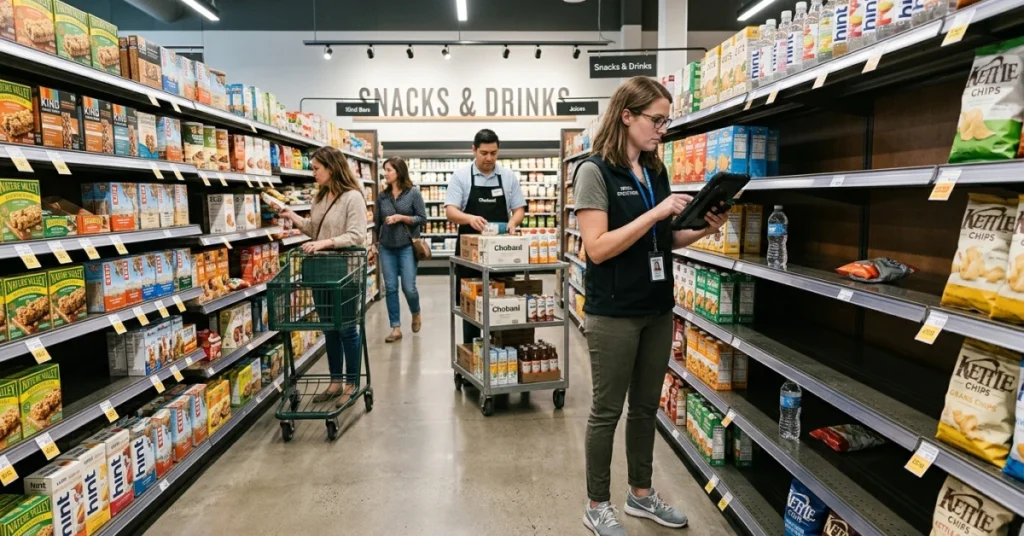
On-shelf availability isn’t a warehouse metric — it’s a store-floor reality check run thousands of times a day. A product counts as available only when a shopper can see it, grab it, and buy it without friction.
Inventory records routinely show stock as present when it’s buried, misplaced, or simply not there — a gap that retail execution tools are specifically built to close.
How Retailers Calculate On-Shelf Availability
The standard formula divides SKUs in-stock and shoppable by total SKUs expected on shelf, expressed as a percentage. An OSA score above 95% is considered best-in-class — but that benchmark assumes your inventory data is accurate, which it often isn’t.
Phantom inventory — stock the system believes exists but shoppers cannot find — inflates OSA scores without improving actual retail inventory availability.
The Difference Between OSA and Out-of-Stock (OOS)
Out-of-stock retail means zero units exist anywhere in the store. Poor on-shelf availability means units exist — but shoppers still can’t buy them.
That distinction matters enormously: OOS triggers a replenishment order, but a phantom inventory gap triggers nothing — it just silently bleeds revenue. According to Agmis, up to 70% of OSA failures stem from in-store execution breakdowns rather than upstream supply shortfalls.
The real question isn’t whether your shelves look stocked — it’s whether your system would even know if they weren’t.
Why Is On-Shelf Availability So Important for Retailers?
Those execution gaps translate directly into lost revenue — and the numbers are brutal. Retailers lose roughly $1 trillion annually to out-of-stock and overstocking combined, yet most of that loss happens at the shelf, not the warehouse.
The uncomfortable truth is that full inventory records don’t guarantee a purchasable product. Phantom inventory — stock the system counts but shoppers can’t find or scan — is the primary, underdiagnosed driver of OSA failures in modern retail.
📊 By the Numbers
Average out-of-stock retail rate sits at 8% globally — doubling during promotions when OSA pressure peaks most.
How Empty Shelves Directly Reduce Revenue
Every out-of-stock moment is a direct revenue event — not a potential one. Studies show 72% of shoppers take immediate action when they hit an empty shelf, and most of that action benefits a competitor (ScienceDirect).
The shelf availability metric isn’t a supply chain scorecard — it’s a real-time revenue signal. When OSA drops even 1%, category revenue follows within the same trading period.
Why Customers Switch Brands After OOS Experiences
A single out-of-stock experience plants doubt about a brand’s reliability — not just a store’s logistics. According to Sciencedirect, over 30% of shoppers who substitute during an OOS event permanently adopt the replacement product.
That’s not a replenishment failure — it’s a brand loyalty failure triggered at store level. Retail inventory availability isn’t just operational; it’s the frontline of customer retention.
The real question isn’t whether empty shelves cost money — it’s why shelves go empty when the inventory system insists they shouldn’t be.
What Causes Low On-Shelf Availability in Stores?
Phantom inventory is the primary culprit — not supplier delays or warehouse shortfalls. Up to 65% of out-of-stocks in retail stores stem from store-level execution failures, not upstream supply chain gaps (Tredence).
The system shows stock on hand, but a misplaced case, a collapsed display, or a misfiled SKU makes that product invisible to shoppers. That gap between recorded inventory and shelf availability metrics is where revenue quietly disappears.
📊 By the Numbers
Retailers lose an estimated $1 trillion annually to inventory distortion — phantom stock is a leading driver.
Weak Shelf Replenishment Processes
Replenishment triggers based on system inventory — not physical shelf counts — create dangerous blind spots. A store can cycle through a reorder point without a single unit reaching the shelf.
Manual replenishment workflows amplify the problem. One missed scan or a backroom pallet left unworked can stall OSA retail performance for an entire category.
Poor Merchandising Execution
Planogram non-compliance directly degrades retail inventory availability — wrong facings, blocked slots, and misplaced SKUs all register as phantom stock. Shoppers abandon the aisle; the system never flags a problem.
Execution gaps at the store level are rarely caught by HQ until weekly reports surface. By then, the lost sales are already gone.
Delayed Field Team Reporting
Field reps visiting stores on weekly cycles cannot catch same-day shelf failures. A product knocked off the shelf Monday morning won’t surface in a report until Friday — if at all.
That latency is a structural flaw in how most retailers manage the out-of-stock retail problem. Speed of detection determines how much revenue is recoverable.
Lack of Real-Time Shelf Visibility
Without real-time data, retailers manage OSA reactively — responding to complaints instead of preventing gaps. The Futuremarketinsights OSA solution market is growing precisely because static reporting can no longer close this gap.
Stores operating without live shelf visibility are essentially flying blind between audit cycles. That’s not a supply chain problem — it’s a data infrastructure problem.
The real question isn’t whether your shelves are stocked — it’s whether you’d know within the hour if they weren’t.
How Do Modern Retailers Track Shelf Availability?
Closing that gap between recorded stock and actual shelf reality requires tools that see what inventory systems cannot. Retailers using real-time shelf monitoring reduce out-of-stock events by up to 30% — yet most still rely on audit cycles that miss phantom inventory entirely.
The core problem isn’t data volume — it’s data latency. Understanding on-shelf availability fundamentals makes clear why store-level execution gaps outlast any replenishment fix.
Mobile Store Audits and Field Data Collection
Field reps using mobile audit apps capture shelf conditions in real time — not 48 hours later. This immediacy is what separates actionable OSA retail data from historical noise.
Structured digital audits force reps to log facings, voids, and misplacements by SKU. That granularity exposes phantom inventory that a warehouse scan will never catch.
AI Shelf Image Recognition Technology
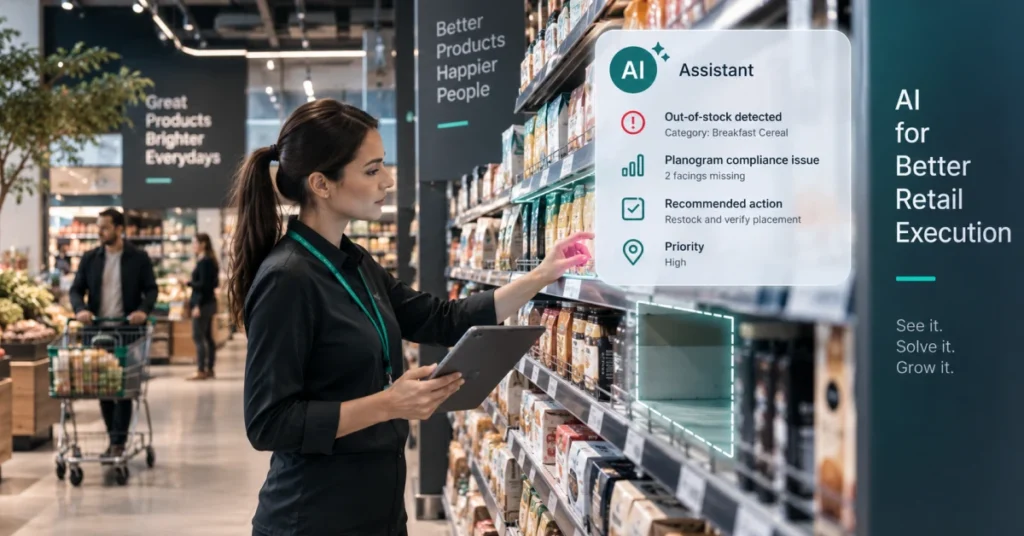
Computer vision systems scan shelf images and flag voids, misplaced SKUs, and planogram deviations within seconds. They turn every store visit into a structured shelf availability metric — without relying on rep memory.
Image recognition also detects phantom inventory directly: product logged as in-stock but visually absent from the shelf. That distinction is one most legacy audit tools cannot make.
Real-Time OSA Dashboards and Alerts
Centralized dashboards aggregate field audit data, POS signals, and inventory feeds into a single retail inventory availability view. Automated alerts push void notifications to store managers before a shopper ever sees an empty peg.
Speed is the variable that matters most here. Agmis notes that retailers who act on OSA alerts within two hours recover significantly more revenue than those running end-of-day exception reports.
Planogram Compliance Monitoring
A product stocked in the wrong bay is functionally out of stock — shoppers won’t find it, and the system won’t flag it. Planogram compliance monitoring catches these execution failures before they register as lost sales.
Out-of-stock retail losses tied to misplacement are consistently underreported because inventory systems show units present. Compliance scoring at the SKU level is the only way to surface that hidden drag on shelf availability metrics.
📊 By the Numbers
Retailers using real-time shelf monitoring tools cut out-of-stock events by up to 30% versus audit-only approaches.
The tools exist — but knowing which metrics those tools should actually measure is what separates retailers who fix symptoms from those who eliminate the root cause.

Which KPIs Matter Most for OSA Performance?
Cutting out-of-stocks by 30% means nothing if you’re measuring the wrong signals. The KPIs that actually expose on-shelf availability failures track execution gaps — not just inventory counts.
Phantom inventory distorts every metric downstream, so your KPI framework must distinguish between system availability and shopper-facing availability. That distinction is where most retail measurement breaks down.
On-Shelf Availability Rate
This is your baseline shelf availability metric — the percentage of time a SKU is physically present and purchasable on the shelf. Retailers targeting above 98% OSA consistently outperform peers on revenue per linear foot.
The trap is calculating this from warehouse data rather than store-level audits. System records and actual shelf reality diverge the moment phantom inventory enters the picture.
Out-of-Stock Frequency
Out-of-stock retail events measured by frequency — not just duration — reveal whether your replenishment triggers are firing correctly. A SKU going out of stock three times weekly signals a systemic execution failure, not a one-off supply hiccup.
According to Losspreventionmedia, out-of-stock events cost retailers an average of 4% in lost sales per affected SKU per week. That compounds fast across a full category.
Shelf Share by Brand or Category
Shelf share measures whether your allocated facing space is actually occupied — a direct proxy for retail inventory availability at the point of purchase. Gaps in shelf share often trace back to phantom stock sitting in back rooms, uncounted and unmoved.
This is where shelf execution tools like FieldPie add measurable value — photo-based audits capture real shelf conditions that POS data simply cannot see.
Replenishment Response Time
This KPI measures the lag between a detected out-of-stock and the moment product returns to the shelf. Sciencedirect research confirms that response time — not stock volume — is the dominant variable in OSA retail performance outcomes.
Every hour of delay is a shopper who substitutes or walks. Tracking response time forces accountability at the store-execution level, not just the supply chain level.
📊 By the Numbers
Retailers with sub-2-hour replenishment response times achieve up to 2.5% higher OSA rates than category averages.
The right KPIs don’t just measure availability — they force you to confront whether your inventory data reflects reality or a phantom version of it that’s quietly costing you sales.
Conclusion
The gap between what your inventory system records and what a shopper can actually buy is where on-shelf availability breaks down — and phantom inventory is the primary culprit most retailers never audit. Fixing replenishment while ignoring phantom stock is like patching a roof without checking the foundation.
Out-of-stock retail losses average 4% of total sales annually — yet the majority of those stockouts are caused by store-level execution failures, not supplier shortfalls. Tredence confirms that predictive OSA models consistently outperform reactive replenishment — but only when fed accurate, shopper-facing shelf data, not warehouse counts.
Retailers who keep blaming their supply chain will keep losing sales to a problem hiding inside their own stores. Audit your phantom inventory rate first — then read these shelf availability improvement strategies before your next planogram reset.
FieldPie captures real-time shelf data through photo-based audits and customizable field forms, so your retail inventory availability reflects what shoppers actually see — not what your system assumes. Teams using FieldPie close the execution gap faster and drive measurable improvement in their shelf availability metric.