✦ Key Takeaways
Effective product merchandising strategies can boost retail sales by up to 400% through optimized placement alone.
- → Visual merchandising drives 70% of purchase decisions in-store.
- → Cross-merchandising adjacent products increases average basket size significantly.
- → Tracking sell-through rate exposes which strategies actually generate revenue.
In this article:
- What Are Product Merchandising Strategies?
- What Types of Product Merchandising Strategies Exist?
- How Does Product Placement Influence Sales?
- How Do Retailers Build Effective Merchandising Strategies?
- Which KPIs Should Retailers Track?
Key takeaway: Retailers who master merchandising strategy own the customer’s attention before competitors do.
What Are Product Merchandising Strategies?
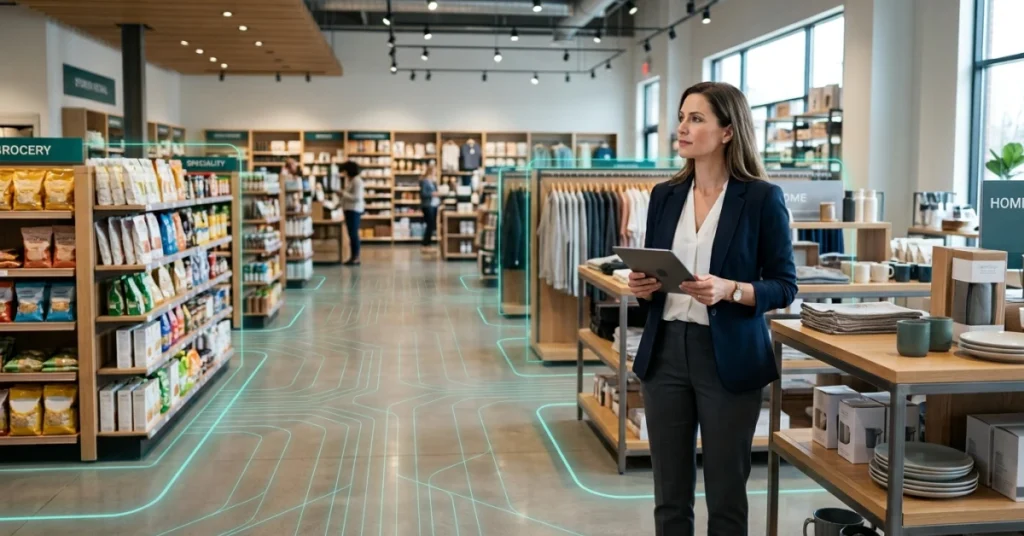
Over 70% of purchase decisions happen at the point of sale — yet most retailers still treat those decisions as inevitable rather than engineered. The shelf — physical or digital — is a behavioral system, and most brands are flying it blind.
Placement, assortment, and measurement aren’t three separate workstreams. When they operate in silos, they actively undermine each other — and the results show up as inconsistent sell-through, margin leakage, and wasted floor space.
Definition and Core Objectives
Product merchandising strategies are the deliberate decisions that control what products appear, where they appear, and how they’re presented to drive conversion. The core objective isn’t aesthetics — it’s engineered shopper behavior at every touchpoint.
This applies equally to in-store merchandising and ecommerce merchandising strategy, where the “shelf” is a search result or a category page. Understanding retail merchandising fundamentals is the foundation every tactic must build on.
Why Merchandising Strategies Matter in Retail
Retailers that integrate visual merchandising with data-driven assortment planning see measurably stronger basket sizes and repeat visits. Without a connected strategy, even high-traffic locations bleed revenue through poor product adjacency and weak category flow.
The gap between instinct-driven and system-driven retail merchandising tactics compounds fast — especially across multi-location operations where inconsistency scales with footprint.
The Difference Between Merchandising and Marketing
Marketing creates demand; merchandising converts it — and confusing the two is where most execution breaks down. (Pubsonline Informs confirms that shelf-level decisions independently drive significant revenue variance, separate from promotional spend.)
Marketing stops at the store entrance. Merchandising strategy owns everything that happens after the shopper walks in — or clicks through.
Before you can build a system that works, you need to know exactly which types of product merchandising strategies are available to deploy — and which ones most retailers are misusing.
What Types of Product Merchandising Strategies Exist?
Treating the shelf as a behavioral system means recognizing that no single tactic works in isolation — placement, assortment, and measurement must be designed as one connected mechanism. Retailers who integrate all three consistently outperform those who don’t, and the gap shows up directly in conversion and basket size.
The core retail merchandising tactics fall into five distinct categories, each targeting a different layer of shopper behavior — from visual attention to data-driven assortment decisions.
📊 By the Numbers
Retailers using integrated merchandising strategies see up to 30% higher conversion rates than those relying on siloed category decisions (Constructor).
Visual Merchandising Strategies
Visual merchandising directs shopper attention before a single word is read. Strategic use of color, lighting, and product height placement can increase dwell time by over 20%.
Cross-Merchandising and Product Bundling
Cross-merchandising places complementary products together to trigger unplanned purchases. Bundling raises average order value by reducing the cognitive effort of building a complete solution.
Seasonal and Promotional Merchandising
Seasonal resets and promotional displays create urgency that flat everyday layouts cannot. Executed without behavioral data, however, they often cannibalize margin rather than grow basket size.
Data-Driven Merchandising Strategies
An effective ecommerce merchandising strategy relies on real purchase-path data — not vendor recommendations or gut instinct. Algolia identifies search behavior and click patterns as the highest-signal inputs for assortment and placement decisions.
Omnichannel Merchandising Approaches
In-store merchandising and digital shelf strategy must reinforce each other — inconsistency between channels erodes shopper trust and brand clarity. Retailers who align both environments around the same behavioral logic convert more reliably across every touchpoint.
Knowing which strategy types exist is only half the equation — where you place a product determines whether any of these strategies actually trigger a purchase decision.

How Does Product Placement Influence Sales?
Placement isn’t decoration — it’s the mechanism that either activates or kills the behavioral system you built in assortment and measurement. Products placed at eye level outsell those on bottom shelves by up to 35%, which means shelf position is a conversion lever, not a stocking preference.
Most retailers still treat placement as a logistics decision — where does this SKU fit? — rather than a psychological one: where does this SKU trigger a purchase? That distinction is where product market positioning moves from theory to measurable shelf performance.
📊 By the Numbers
Eye-level product placement can increase unit sales by up to 35% compared to floor-level positioning.
Eye-Level Shelf Placement Strategies
Eye-level shelf space is the most contested real estate in retail — and for good reason. Shoppers make over 70% of purchase decisions at the shelf, making vertical position a direct sales driver in any in-store merchandising plan.
Effective visual merchandising assigns your highest-margin SKUs to eye level first, then builds outward. Treating eye-level placement as a default rather than a deliberate choice wastes your most powerful conversion zone.
High-Traffic Area Product Positioning
High-traffic zones — store entrances, main aisles, and category intersections — generate disproportionate exposure without requiring additional ad spend. Brands that anchor new or high-margin products in these zones consistently see faster trial rates than those relying on standard planogram placement.
Retail merchandising tactics that ignore traffic flow data are essentially guessing. Positioning without flow analysis leaves revenue on the floor — literally.
Endcap and Checkout Merchandising Tactics
Endcaps drive 30% more sales than mid-aisle placement, according to Flameanalytics — yet most retailers fill them reactively with promotional overflow rather than strategically chosen high-velocity SKUs. Checkout zones compound this: impulse categories placed there consistently lift basket size without increasing shopper effort.
The mistake is treating endcaps as temporary real estate rather than permanent behavioral triggers. Every endcap reset is a conversion opportunity that most product merchandising strategies squander.
Shelf Layout and Customer Flow Optimization
Shelf layout shapes how shoppers navigate — and navigation determines what they see, consider, and buy. Vibeiq confirms that data-driven assortment and layout decisions consistently outperform category intuition on both sell-through rate and margin per linear foot.
An ecommerce merchandising strategy faces the same logic: page layout, sort order, and featured placement are the digital shelf. Optimizing flow — physical or digital — is what separates a merchandising system from a merchandising guess.
The real question isn’t whether placement influences sales — it’s whether your current placement decisions are built on behavioral data or inherited habit, and that question points directly to how the strategy itself gets built.
How Do Retailers Build Effective Merchandising Strategies?
That psychological trigger only converts when the entire system — placement, assortment, and measurement — is designed as one unit. Treating product merchandising strategies as a checklist of tactics is exactly why most retailers see inconsistent results across locations.
According to Blog Thirdchannel, retailers who align shelf placement with shopper behavior data see up to 18% higher sell-through rates than those relying on vendor-driven planograms.
The shelf — physical or digital — is a behavioral system. Every element must reinforce the others, or they quietly cancel each other out.
📊 By the Numbers
Retailers aligning placement with behavior data report up to 18% higher sell-through rates than vendor-planogram-dependent competitors.
Understanding Customer Buying Behavior
Shoppers make over 70% of purchase decisions at the shelf — which means placement is the last moment of persuasion, not a neutral logistics choice. Effective in-store merchandising tactics are built around how shoppers actually move, pause, and decide.
Eye-level placement, adjacency logic, and category flow aren’t aesthetic preferences. They’re behavioral levers that either accelerate or kill conversion.
Using Sales and Inventory Data
Gut instinct and vendor recommendations don’t scale — data does. Retailers who feed real-time inventory and velocity data back into shelf design close the feedback loop that most strategies are missing.
Without that loop, assortment decisions are made in a vacuum. The shelf reflects what was ordered, not what shoppers actually want.
Standardizing Store Execution Across Locations
A strategy that works in one store but varies across 50 locations isn’t a strategy — it’s a hypothesis. Consistent retail merchandising tactics require documented standards, field verification, and accountability at the store level.
Contravision reports that visual merchandising inconsistencies across locations directly erode brand trust and reduce basket size. Execution gaps aren’t operational noise — they’re revenue leaks.
Aligning Merchandising With Promotions and Campaigns
Promotional displays that don’t match the ecommerce merchandising strategy create friction — shoppers see one message online and a different reality in-store. Alignment between campaign creative and shelf execution is where most retailers lose the conversion they already paid to generate.
When promotions and placement are designed together, every marketing dollar works harder. When they’re siloed, they compete against each other.
Building this system is only half the work — the other half is knowing exactly which numbers tell you whether it’s performing.

Which KPIs Should Retailers Track?
Closing the feedback loop between shelf design and shopper behavior requires more than good intentions — it requires retail KPIs that measure execution. Without the right metrics, even well-designed product merchandising strategies operate blind.
Retailers who track execution-level KPIs outperform those who rely on sales totals alone. Shelf compliance gaps alone cost retailers up to 8% in lost sales annually (Bluecherry), which is precisely why measurement must be built into the merchandising system — not bolted on after the fact.
Sales Per Square Foot
This metric reveals whether your placement decisions are converting space into revenue. Low numbers signal a mismatch between assortment, visual merchandising, and shopper intent.
Shelf Compliance Rate
Compliance rate measures how consistently planograms are executed across locations. A 10% compliance gap at 500 stores is not a minor variance — it’s a systemic failure in your in-store merchandising strategy.
On-Shelf Availability (OSA)
OSA tracks whether the right products are physically present when shoppers reach the shelf. Poor OSA silently destroys conversion rates that no ecommerce merchandising strategy can recover downstream.
Product Sell-Through Rate
Sell-through rate exposes whether your assortment decisions match actual demand — not projected demand. It’s the clearest signal that placement and product selection are either working together or quietly undermining each other.
Share of Shelf Performance
Share of shelf measures your brand’s physical presence relative to competitors at the point of decision. According to Bluecherry, brands that actively manage shelf share see measurably stronger category conversion rates.
Constructor reinforces this — shelf positioning drives purchase decisions before price or promotion even registers with shoppers.
FieldPie captures photo-based shelf compliance data in real time, giving merchandising teams a live view of execution gaps across every location. That visibility turns these five KPIs from lagging reports into active levers — which is exactly what a behavioral shelf system demands.
📊 By the Numbers
Retailers with strong shelf compliance programs recover up to 8% in otherwise lost annual sales.
The KPIs above don’t just measure performance — they expose exactly which merchandising decisions need to be rebuilt from the shelf up.
Conclusion
Execution-level metrics only deliver value when placement, assortment, and measurement are designed as one system — not three separate workstreams. Retailers who treat product merchandising strategies as a behavioral system consistently outperform those who rely on siloed category decisions.
Retailers lose an estimated 20–30% of potential shelf revenue to poor execution visibility — gaps between planned and actual in-store merchandising that never get measured (according to Flameanalytics). Your next move is concrete: audit one current merchandising decision against the KPIs from Section 5 and identify where the feedback loop breaks.
Most retail teams can’t close that gap because field execution data never reaches the people making shelf decisions. FieldPie captures photo-based compliance, real-time audit data, and performance reporting at the point of execution — so visual merchandising decisions are grounded in what’s actually happening on the floor.
Start with one shelf, one metric, and one audit cycle — then scale what works. Sba data confirms that businesses using structured market and execution data improve decision accuracy by over 30% compared to those relying on intuition alone.