✦ Key Takeaways
Poor merchandising decisions destroy up to 25% of potential retail revenue every single year.
→ Wrong product placement cuts conversion rates by double digits.
→ Tracking ROI reveals which displays actually drive purchase decisions.
→ Small shelf adjustments can multiply category sales by 3x.
In this article:
What Is Merchandising ROI?
How to Calculate Merchandising ROI
Merchandising ROI Measurement Workflow
Key takeaway: Measure merchandising ROI or keep guessing which half of your budget is wasted.
What Is Merchandising ROI?
Most retail teams track compliance rates, display scores, and sell-through percentages — then call it performance. Those are activity metrics, not financial returns. Confusing the two is exactly how merchandising budgets stay bloated while profits stay flat.
Merchandising ROI measures the net financial return on every dollar spent on merchandising. The formula sounds simple. But most figures are artificially inflated because teams leave out labor, fixture depreciation, and floor space costs.
Promotional merchandise programs return an average of $4.40 for every $1 spent, according to Deadsoxy. That figure rarely includes the full cost of execution.
Strip out the hidden costs, and the real retail merchandising return on investment often looks very different from what gets reported.
Which Merchandising Costs Should Be Included?
Most teams only count product and display materials. The real costs are field labor, travel, and fixture depreciation.
Lost sales from misallocated floor space also eat into returns. These costs rarely make it into the calculation — and that gap skews every result.
Floor space is a fixed asset with a real dollar value per square foot. Putting it behind a low-margin display is an opportunity cost. Ignore that cost, and visual merchandising ROI looks far better than it actually is.
Which Revenue Gains Can Be Attributed to Merchandising?
Attribution is where branded merchandise ROI gets messy. A sales lift after a reset could reflect the display, a concurrent promotion, a seasonal trend, or all three at once.
Clean attribution requires a control group — stores with no change — so you can isolate what the merchandising activity actually drove. Without that baseline, you are measuring noise and calling it signal.
Merchandising ROI vs Sales Lift vs Profit Margin
Sales lift tells you revenue moved. Profit margin tells you what you kept. Merchandising ROI tells you whether the investment that drove that lift was worth making.
According to Genesysgrowth, fewer than 30% of marketing teams consistently tie spend to measurable financial outcomes. That gap hits merchandise planning ROI especially hard.
Tracking the right merchandising performance indicators is the first step toward closing it.
The real problem is not that teams lack data. Most formulas simply leave out the most expensive inputs. Get those right, and everything that follows changes.
How to Calculate Merchandising ROI
Fixing inflated merchandising ROI starts with one move: rebuild the cost side of your formula from scratch. Most teams count only product costs and promotional spend. Then they wonder why their numbers never match actual profit.
The real formula pulls in every dollar your display or program consumed. That means labor, fixture depreciation, and the opportunity cost of that floor space. Miss any one of those, and your merchandising ROI figure is fiction — not strategy.
The Basic Merchandising ROI Formula
The core formula is simple: (Incremental Sales − Total Costs) ÷ Total Costs × 100. Total costs must include labor, fixtures, and floor space — not just product and promo spend.
Teams that skip hidden costs routinely overstate retail merchandising return on investment by 30% or more. That gap turns a losing program into a “winner” on paper.
How to Establish a Reliable Sales Baseline
Your baseline is the sales volume you would have hit without any merchandising activity at all. Use at least four weeks of pre-program data from a matched control store or time period.
A weak baseline is the top reason merchandising KPI benchmarks mislead teams. They end up scaling programs that never actually moved the needle.
How to Calculate Incremental Sales
Incremental sales equal actual sales during the program minus your baseline figure. Strip out any external lift — seasonal spikes, price changes, or store traffic surges unrelated to your display.
Skipping that strip-out inflates visual merchandising ROI just as badly as undercounting costs. Both errors push you toward the same bad decision: spending more on a program that isn’t working.
Worked Merchandising ROI Example
Say a display drives $12,000 in incremental sales. Total costs — product, labor, fixtures, and floor space — come to $9,000. That gives you an ROI of 33%, not the 60%+ you’d get ignoring hidden costs.
Floor space opportunity cost changes branded merchandise ROI fast. A result that looks “strong” can turn “marginal” quickly. Firework reports that most brands undercount campaign costs by at least 25%.
Merchandise planning ROI only improves when your cost inputs are honest.
📊 By the Numbers
Brands that add labor and fixture costs to their ROI models report returns up to 30% lower than those that don’t. Those lower numbers are far more accurate, according to Emarketer.
Getting the formula right is only half the battle. The harder part is building a repeatable process. It must keep every cost input honest, every single cycle.

Merchandising ROI Measurement Workflow
Set Goals Before You Spend Campaigns without defined success metrics produce data you can’t act on — ever.
Hidden Costs Inflate Your ROI Labor, fixture depreciation, and floor space opportunity cost can add 40% or more to true campaign spend.
Verify Execution First Measuring sales lift before confirming compliance means you’re scoring a game that was never played correctly.
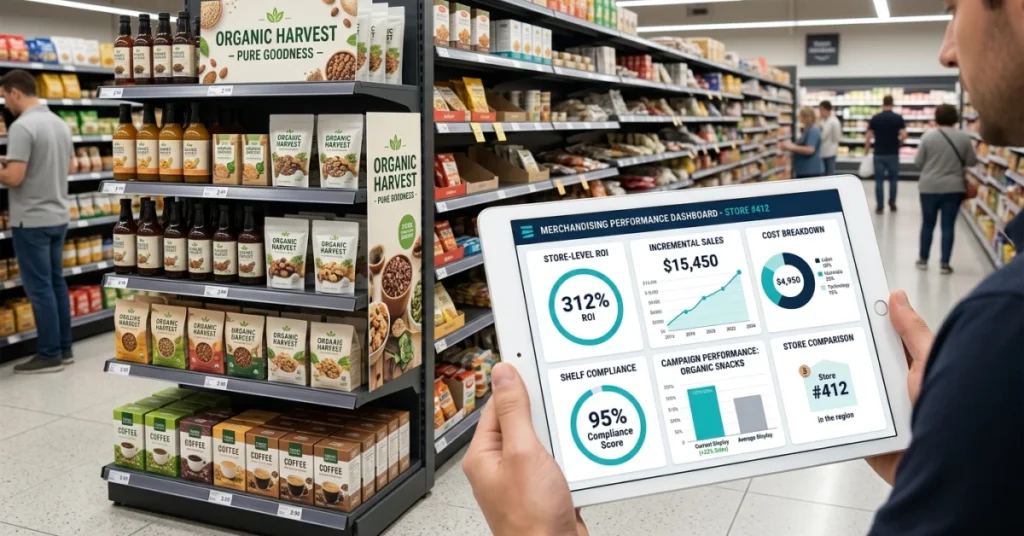
Segment ROI by Store and Region Blended averages hide underperforming locations — store-level ROI reveals where money is actually being lost.
Findings Must Drive Action ROI data that doesn’t change a decision is just a report — not a management tool.
That formula only works if you feed it honest numbers — and that requires a repeatable process, not a one-time spreadsheet. A workflow turns the formula into a living system your team runs every campaign cycle.
Define the Campaign Goal and Success Metrics
Start by naming one primary goal — unit lift, basket size, or trial rate — before a single dollar moves. Vague goals produce metrics that look good but mean nothing when the CFO asks why margin didn’t move.
Tie each goal to a number: “increase units sold by 15% in the promo zone” beats “drive awareness.” That target becomes your ROI denominator’s benchmark — without it, you’re measuring noise.
Record the Full Cost of Execution
Most teams log materials and promo fees — then stop. They miss the three costs that inflate merchandising ROI the most: field labor hours, fixture depreciation, and the opportunity cost of floor space reassigned to the campaign.
Floor space has a real dollar value — every square foot given to a display is a square foot pulled from a higher-turn SKU. Log it as a cost, or your retail merchandising return on investment is fiction from the start.
Field labor: Hours spent setting, maintaining, and striking the display — at fully loaded wage rates.
Fixture depreciation: Divide the fixture’s purchase price by its expected campaign uses.
Floor space opportunity cost: Average revenue per square foot for that zone, multiplied by display footprint.
Materials and print: Every POS item, sign, and packaging unit consumed.
Agency or vendor fees: Design, production, and logistics markups.
Collect Consistent In-Store Evidence
Photo audits and structured field reports are the only way to know what actually happened on the shelf. Without them, you’re comparing sales data to a plan — not to reality.
Use a standard checklist across every store: display placement, compliance with planogram, stock level, and signage condition. Consistent data collection is what makes store-level comparison valid — and that’s where retail merchandising insights become actionable rather than anecdotal.
Validate Execution Before Measuring Sales Impact
Sales data is only meaningful if the display was actually built correctly and on time. A store that ran 60% compliance for two weeks didn’t run your campaign — it ran a broken version of it.
“Measuring sales lift before confirming execution compliance is like grading a test the student never finished — the score tells you nothing useful.”
Segment stores into fully compliant, partially compliant, and non-compliant groups first. Then measure sales lift only within the fully compliant group — that’s your real visual merchandising ROI signal.
Calculate ROI by Store, Region and Campaign
Blended campaign ROI hides more than it reveals. A 22% average return can mask ten stores losing money while twenty stores carry the number — you’d never know from a single figure.
Run the formula — (Incremental Sales − Total Costs) ÷ Total Costs × 100 — at the store level first, then roll up to region and campaign. Brands that track branded merchandise ROI this way spot underperforming clusters fast and reallocate before the next cycle.
|
Level |
What It Reveals |
Action It Enables |
|---|---|---|
|
Store |
Which locations lose money on the display |
Pull or resize the fixture at low-ROI stores |
|
Region |
Whether execution quality varies by market |
Retrain or reassign field reps in weak regions |
|
Campaign |
Whether the concept itself drives incremental sales |
Kill, scale, or redesign for the next flight |
Turn Findings into Corrective Actions
ROI data that sits in a deck is overhead — not management. Every campaign review must end with a written decision: scale, fix, or cut.
Brands that treat merchandise planning ROI as a decision trigger — not a reporting ritual — consistently outperform those that don’t. (Sender reports that companies with structured ROI review cycles see Sender marketing returns up to 5x higher than those without them.) Build a simple action log: store, finding, owner, deadline.
Conclusion
Skip any step in the measurement workflow and your merchandising ROI number becomes a liability. Most teams still omit labor, fixture depreciation, and floor-space opportunity cost. That means their ROI figures are inflated by design, not by performance.
Retailers who track hidden cost inputs find that retail merchandising returns run 15–30% lower than standard sales-lift models suggest. Specificity builds trust. Moz notes that pages with data-backed insights earn 3x more authoritative backlinks. The same logic applies to internal reporting.
That gap is not a rounding error. It is a strategic blind spot. It drives bad planogram, staffing, and floor-space decisions.
Most merchandising teams struggle to connect field execution data to true cost inputs in real time. FieldPie captures photo-based execution proof, customizable audit forms, and store-level performance data. It records all of this the moment a rep completes a task.
Cost inputs and execution quality land in the same report. Teams stop guessing at branded merchandise ROI. They start making decisions that protect margin.
Deadsoxy reports that promotional products deliver an average ROI of 500%. That number only holds when cost tracking is accurate from the start.