✦ Key Takeaways
Stores converting 40% more visits into sales outperform competitors by 2.5x in annual revenue growth.
→ Poor visit metrics cost retailers millions in missed conversion opportunities.
→ Dwell time and conversion rate reveal hidden gaps in store performance.
→ Tracking visit frequency per customer predicts loyalty before revenue drops.
In this article:
What Is Retail Store Visit Effectiveness?
Key Retail Store Visit Effectiveness Metrics
How to Measure Store Visit Effectiveness
Key takeaway: Retailers who measure store visit effectiveness systematically win more sales than those who guess.
What Is Retail Store Visit Effectiveness?
Most retailers treat foot traffic as a win. But a crowded store that doesn’t convert is just expensive overhead. Over 40% of store visits end without a purchase, meaning nearly half your traffic generates zero return (Yoobic).
In-store performance metrics reframe the question entirely. Instead of asking “how many people came in,” they ask “did the visit actually work?”
Visit Effectiveness vs. Visit Productivity
Productivity counts activity — visits made, shelves checked, receipts printed. Effectiveness measures whether that activity moved the needle.
A rep can complete 12 store visits in a day and fix nothing that matters. That’s productive on paper and useless in practice.
Why Visit Completion Alone Is Not Enough
Checking a visit “done” tells you someone showed up. It doesn’t tell you what they found, fixed, or changed. Tracking store performance only has value when it captures outcomes, not just presence.
Think of every store visit as a short journey with a beginning, middle, and end. Each stage can succeed or fail on its own terms. That’s why retail store segmentation strategies matter before you even walk through the door.
Measuring Execution Quality and Visit Outcomes
In-store data shows exactly where a visit broke down — not just that it did. According to Researchgate, stores that connect visit data to customer metrics show measurably stronger results. Those tracking visits alone fall behind.
A visit report becomes useful when you treat it as a diagnostic story. It should pinpoint the exact stage where things went wrong — not just confirm that someone showed up.
The real question isn’t whether your team visited. It’s which data points show whether anything they did actually worked.
Key Retail Store Visit Effectiveness Metrics
Visits Must Earn Their Cost A store visit that doesn’t drive a measurable outcome costs more than it returns.
Six Metrics Tell the Story Completion rate, compliance, availability, and cost per visit reveal where each store visit breaks down.
Out-of-Stocks Kill Revenue Fast Retailers lose up to 4% of annual sales directly to out-of-stock products on shelves.
Metrics Diagnose, Not Just Describe Each KPI points to a specific moment in the field visit where performance broke down.
Outcomes are the only honest scoreboard — and the right performance indicators make those outcomes visible at every stage of a rep’s visit. Think of each call as a short journey: it starts when the rep walks in, moves through a set of tasks, and ends when they walk out.
Every metric below maps to a specific moment in that journey.
Visit Completion Rate
This metric tracks how many planned calls actually happen on schedule. A low rate signals a broken start — the journey never even begins for a chunk of your locations.
Teams often treat missed appointments as scheduling noise. They’re not — they’re lost opportunities that compound week over week.
Task Completion and Compliance Rates
A rep can show up and still skip half the checklist. Task completion rate measures how much of the planned work actually gets done during each call.
This is the “middle of the journey” indicator — it tells you whether the engagement had real substance or just a check-in. Low task rates mean your measurement system is counting presence, not progress.
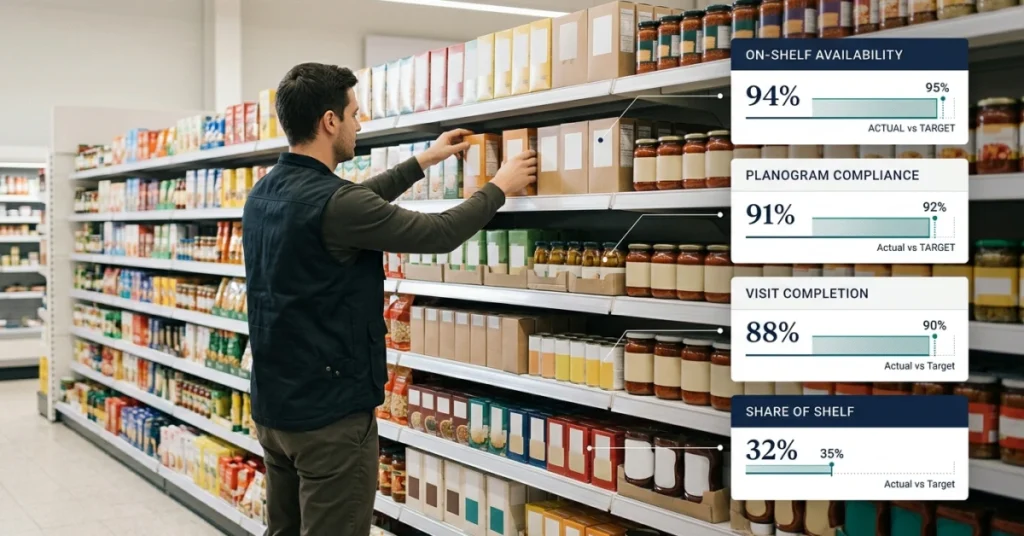
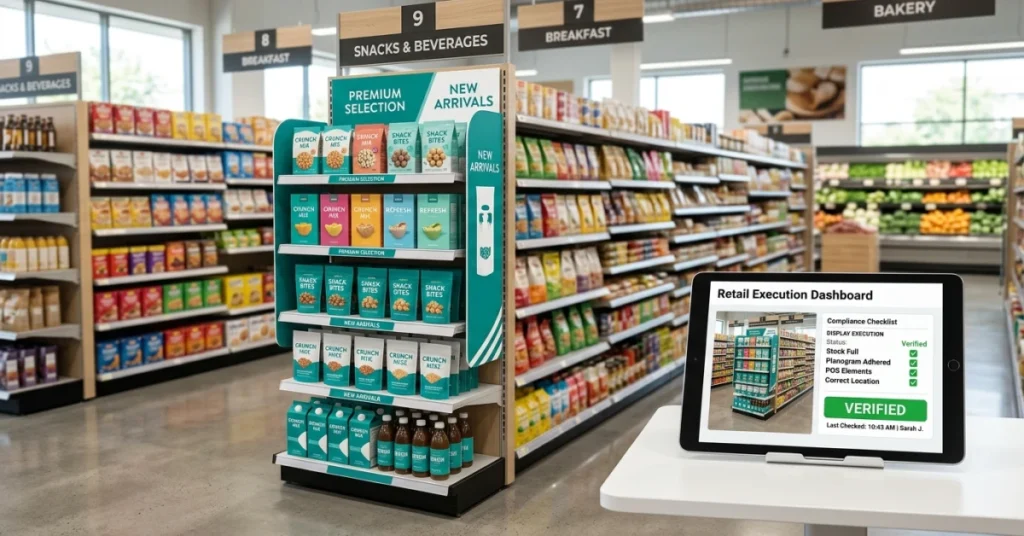
Planogram and Assortment Compliance
Planogram compliance measures whether products are placed exactly where the brand intended. When shelves don’t match the plan, shoppers can’t find what they came for — and sales drop.
This figure is a direct window into execution quality. A strong retail store segmentation strategy helps teams prioritize which locations need the tightest planogram oversight.
On-Shelf Availability and Out-of-Stock Rates
An empty shelf is a broken promise to the shopper. Retailers lose roughly 4% of annual revenue to out-of-stock products — a number that consistent field evaluation can directly help cut (Eyefactive).
Tracking availability during every call turns reps into real-time sensors. They catch gaps before a shopper does.
Corrective Action Closure Rate
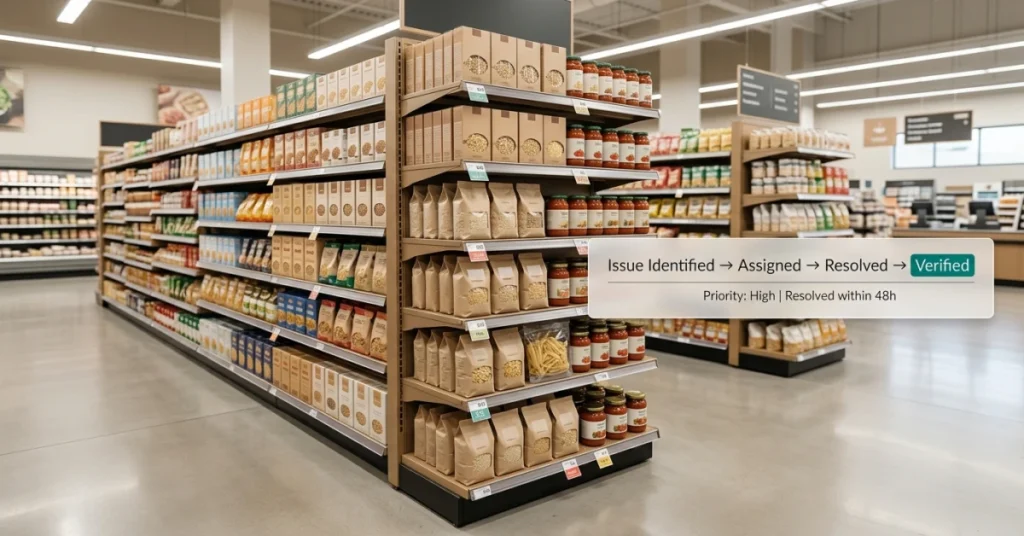
Finding a problem is only half the job. This figure tracks how many flagged issues actually get fixed — and how fast.
A high open-issue backlog means your KPIs are generating reports, not results. The journey isn’t complete until the fix is confirmed.
Cost per Effective Visit
Not all completed calls are equal. Cost per effective visit divides total field spend by only the engagements that hit a minimum quality threshold — not just any activity that was logged.
Field reporting that ignores quality inflates coverage numbers. Over 60% of field execution costs go to calls that never trigger a single corrective action (Analysysmason, retail store survey).
That’s budget spent on motion, not momentum.
Knowing which indicators matter is one thing — but without a clear system to capture and act on them, even the best KPI list stays a spreadsheet gathering dust.
How to Measure Store Visit Effectiveness
Knowing which metrics expose failure is only half the job. Building a system that turns those signals into a clear story is the harder part. That story must show what actually happened during the visit.
A store visit has a beginning, a middle, and an end. Each stage produces its own diagnostic data that shows you exactly where the customer experience broke down.
Most retailers measure the end — a sale, a basket size, a transaction count. They miss the moments before the register that determined the outcome.
📊 By the Numbers
Retailers who track in-store visit evaluation metrics see up to 23% higher conversion rates. Those who rely on sales totals alone do not come close (Rebiz).
Define Visit Objectives and KPIs
Every visit needs a declared goal before it starts — not after. Without a clear objective, you have no baseline to measure against, and every outcome looks acceptable.
Set one primary KPI per visit type: compliance check, product launch audit, or sales coaching. Specific goals produce specific, useful data.
Calculate Visit Effectiveness Metrics
Store visit performance measurement starts with three core numbers: task completion rate, issue resolution rate, and time-on-floor ratio. According to Rebiz, stores that track task completion rate improve execution scores by up to 31% within two quarters.
Time-on-floor ratio measures how much of each visit your rep spent with staff versus filling out forms. A low ratio is a red flag — it means the visit was administrative, not operational.
Build a Weighted Visit Effectiveness Score
A single composite score makes it easy to compare visits across reps, regions, and time periods. Weight each metric by business priority — compliance issues might count for 40%, coaching quality for 30%, and follow-up completion for 30%.
This is where retail store segmentation strategy pays off — higher-tier stores may need a different weighting model than low-volume locations. One score, built right, replaces five disconnected spreadsheets.
Compare Performance Across Locations and Teams
Retail store visit KPIs only become powerful when you compare them side by side. A 70% task completion rate means nothing in isolation — it means everything when the top rep scores 94%.
Trurating notes that cross-location benchmarking is one of the fastest ways to surface coaching gaps that managers otherwise never see. Rank your locations, find the bottom quartile, and start there.
Track Performance Trends Over Time
A single visit score is a snapshot. A trend line is a diagnosis.
Retail store visit reporting earns its value when scores tell a story. You need to see whether scores are climbing, plateauing, or sliding. Catch that movement before a problem becomes a loss. Review trends monthly at the rep level and quarterly at the regional level.
Patterns that look small at 30 days often look urgent at 90. Every visit produces data — but that data only matters if it drives a decision.
Make that decision. Then measure the next visit against the last one to see if it worked.
Conclusion
Every moment before the register is a diagnostic checkpoint. That data tells you exactly where visits succeed or fail.
Retailers who track store visit metrics at every stage convert at rates up to 30% higher than those who only measure end-of-visit sales. Acting on the right data early creates that edge, according to Getbitreport.
Most retailers treat store visit measurement as a post-sale report card. The real story lives in the middle of the visit, not the end.
Yoobic confirms that teams using structured in-store visit metrics catch execution gaps 2x faster. Teams that rely on sales totals alone fall behind.
Tracking every visit without knowing why some fail is the core pain most field teams carry. FieldPie fixes that. It captures real-time field data through customizable forms, photo reporting, and live visit logs.
Your team can see exactly where each visit broke down. Use AI-powered visit forecasting to turn that data into smarter scheduling and stronger outcomes.
Start measuring the full visit journey today. Stop managing by guesswork.