✦ Key Takeaways
Secondary displays drive up to 25% more impulse purchases when executed correctly at retail.
→ Poor placement kills sales before shoppers ever engage — max 10 words.
→ Compliance gaps between planned and actual displays cost brands millions annually.
→ Measuring display execution in real time fixes problems before sales are lost.
In this article:
What Is Secondary Display Execution?
How to Plan Secondary Displays
How to Measure Display Compliance
Key takeaway: Brands that master secondary display execution own the purchase decision at shelf.
What Is Secondary Display Execution?
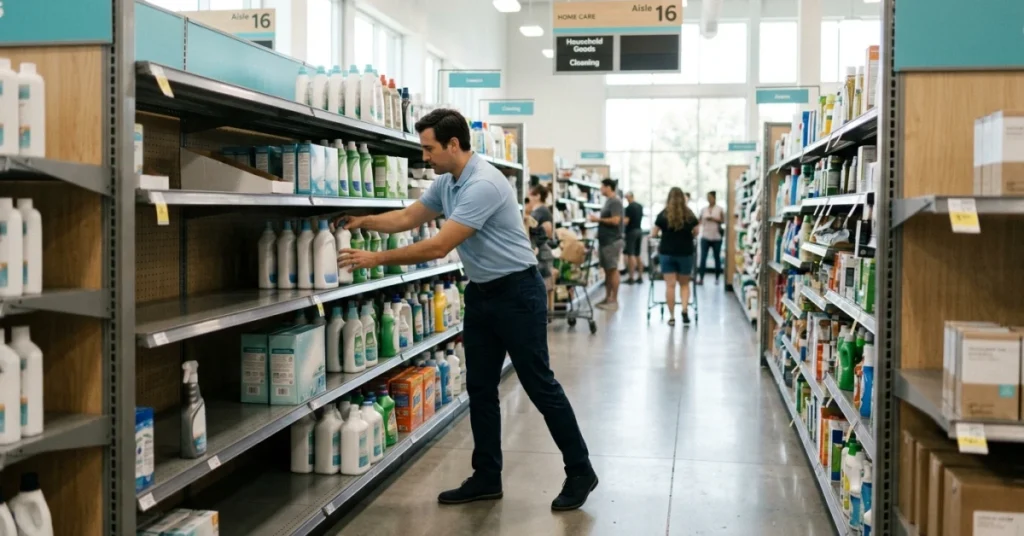
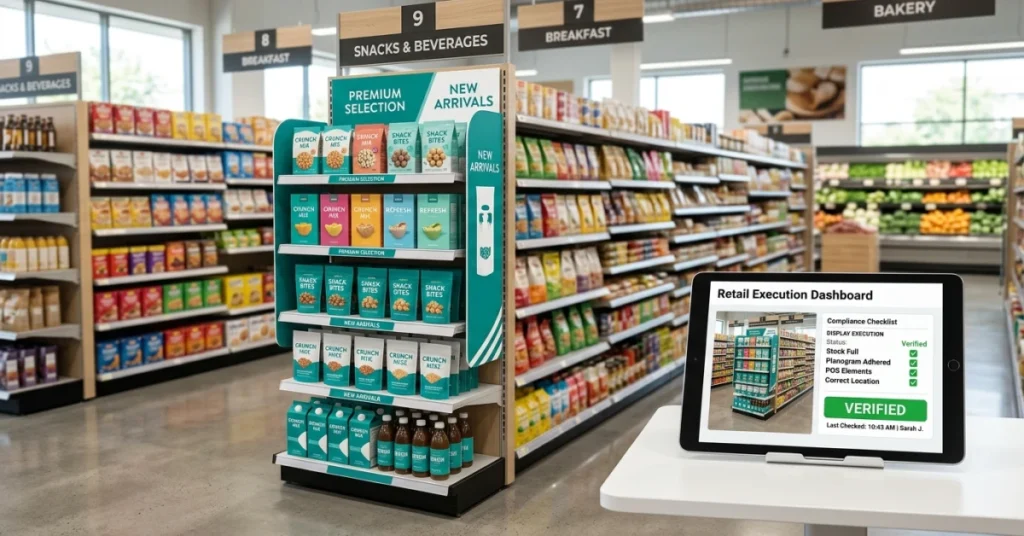
You’ve walked past it a hundred times. It’s a cardboard display stacked with snack bags at the end of a grocery aisle — nowhere near the chip section.
That standalone unit is a secondary display. Getting it built, placed, and stocked on the sales floor is what secondary display execution means.
Brands spend billions on these placements, yet most have no reliable way to confirm the display ever left the back room.
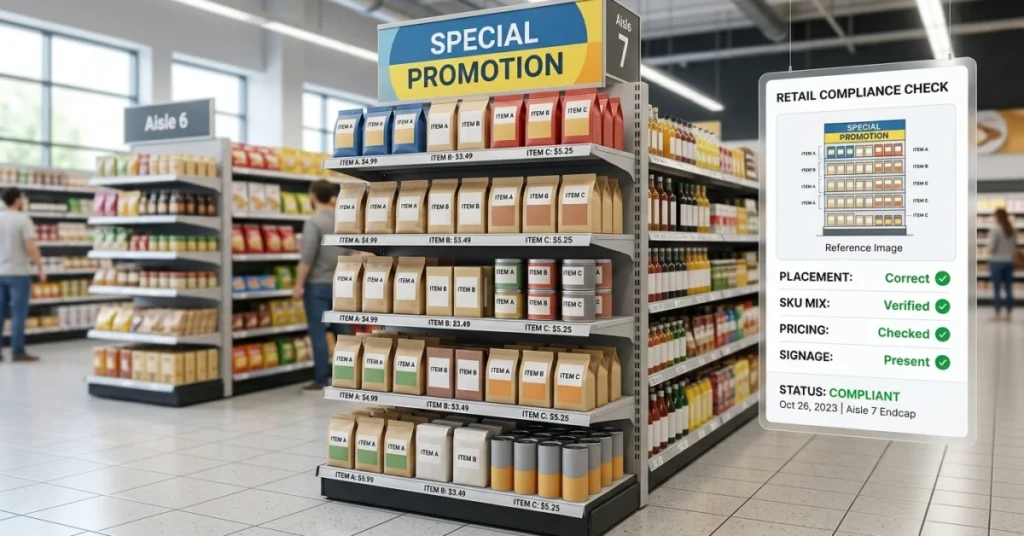
The compliance gap is the real problem. Over 50% of secondary displays are never fully executed as planned. That means brands pay for prime floor space and get nothing in return (Statista).
That silent loss is why execution deserves as much attention as the creative design itself.
Types of Secondary Displays
Secondary displays come in several forms: freestanding floor units, end caps, pallet displays, and clip strips near checkout lanes. Each type targets a different shopper moment and serves a different sales goal.
Choosing the right format matters, but placing it correctly matters more. A multi-display execution window — the short time a promotion is live — closes fast. A wrong placement wastes the entire budget.
Benefits of Secondary Displays
Secondary displays interrupt the shopper’s path and trigger unplanned purchases — that’s their entire job. Studies show impulse buys make up to 40% of all retail purchases. That makes well-placed displays one of the highest-ROI tools a brand can use.
A parallel execution display runs alongside a main shelf promotion. It can lift sales by double digits during a campaign window. But that lift only happens when the display is on the floor, built correctly, and stocked.
Secondary Displays vs. Planograms
A planogram tells store teams exactly where every product sits on a permanent shelf. Secondary display execution is different — it’s temporary, negotiated separately, and far easier to skip without anyone noticing.
Research Mountain flags attention fragmentation as a core retail risk. Store teams juggle dozens of tasks, and an unbuilt display rarely triggers an alarm.
Understanding retail reset execution is the first step toward closing that gap. According to Statista, brands that track in-store compliance see up to 18% higher promotional ROI than those that don’t.
Before you can fix execution, you need a plan — and most brands skip the hardest part of building one.
How to Plan Secondary Displays
Over half of displays never fully reach the floor. That single fact shows where most brands lose: planning.
A solid plan doesn’t just describe what the display looks like. It maps every step from factory to sales floor.
Secondary display execution fails most often because brands treat planning as a creative brief, not a logistics operation. The design is the easy part — getting the right unit to the right store at the right time is where real money gets lost.
Set Display Goals and Requirements
Start with a clear number: how many units do you need built and stocked by launch day? Without a hard target, field teams have no standard to hit — and no one notices when they miss.
Define what “done” looks like before a single display ships. That means specifying product count, placement height, and signage — not just sending a photo of the finished design.
Choose the Right Display Locations
Not every aisle drives the same traffic. End caps near checkout convert at nearly 3x the rate of mid-aisle placements — so location decisions directly shape your return.
Picking spots without foot-traffic data is guessing with a large budget. Good retail space planning maps shopper flow before locking in placement.
Negotiate specific locations with retailers in writing. A vague agreement almost always becomes a bad spot.
Plan Inventory and Installation
Brands that skip inventory staging often find displays sitting unbuilt in stockrooms weeks after launch. Multi-UUT execution view data confirms this — it shows stock gaps across dozens of stores at once.
Build a delivery window that gives store staff enough time to set up before peak traffic hits. Coordinate with your distributor and the retailer’s receiving team at least two weeks out.
A display that arrives during a reset week will almost always lose to other priorities.
Create Execution Guidelines
Every person who touches the display — from the driver to the store associate — needs a one-page instruction sheet with photos. Ambiguity at this stage is what turns a great design into a crooked, half-stocked unit shoved against a wall.
Studies show that workers using clear visual guides make fewer errors and finish tasks faster. Research on Plugable confirms that structured visual workflows cut mistakes significantly.
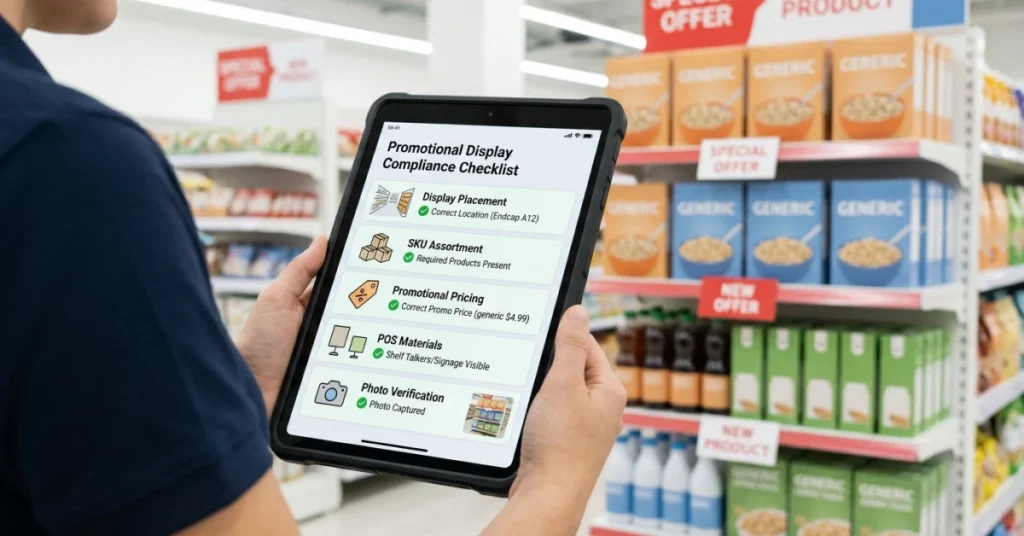
Apply that same logic to your field team’s parallel execution display checklist.
📊 By the Numbers
End-cap displays generate up to 3x more sales lift than standard mid-aisle secondary placements. (Pmc Ncbi Nlm Nih)
A plan this detailed only pays off if someone verifies it was actually followed. That raises the question every brand needs to answer before the next launch.

How to Measure Display Compliance
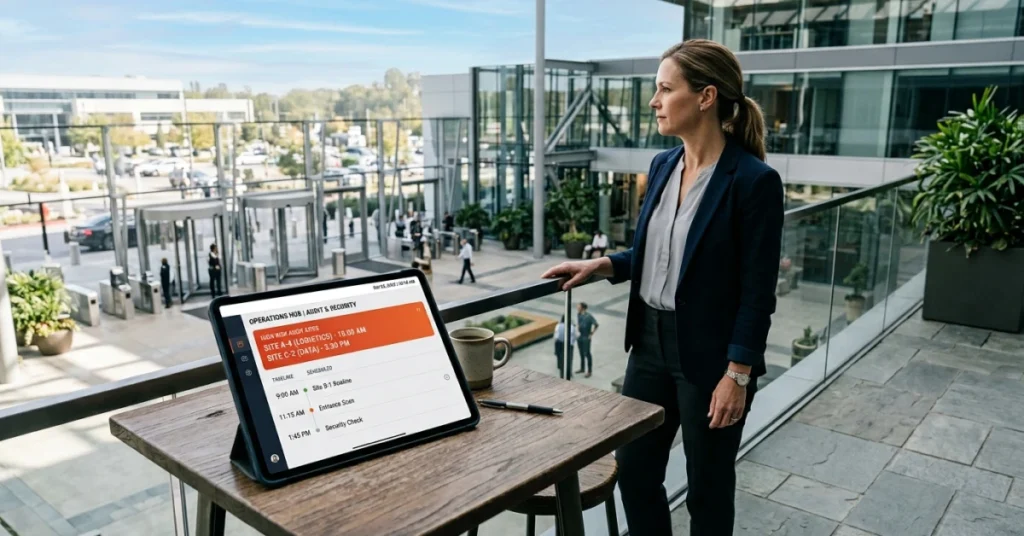
Once the logistics plan exists, the next question is brutal and simple: did the display actually make it to the floor?
Most brands never answer that question with real data. They assume compliance happened because they paid for it.
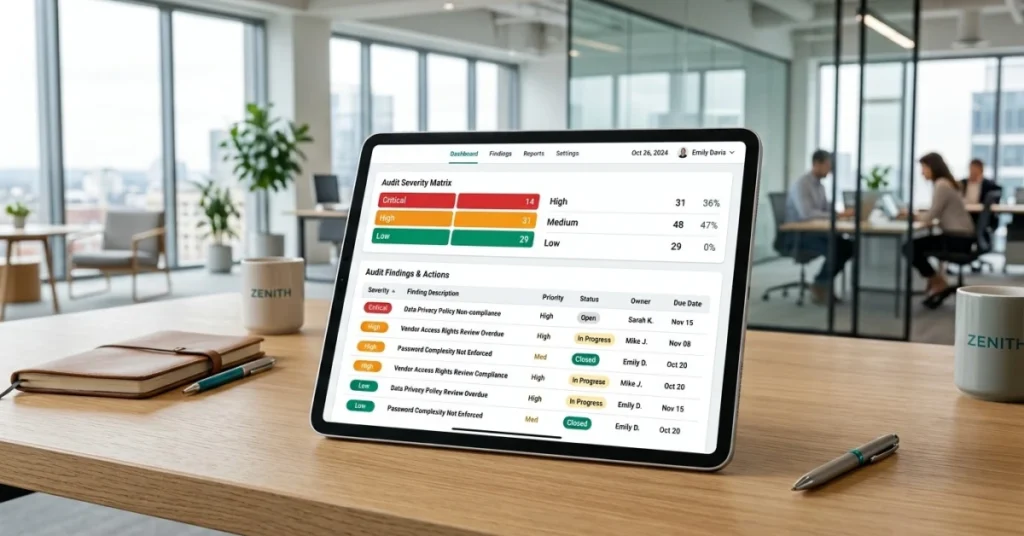
Secondary display execution fails silently. A brand can lose millions in missed sales without a single alert, because no system flagged the display sitting flat in a stockroom.
Compliance Formula and Example
The math is straightforward: divide the number of displays confirmed on the floor by the total stores contracted, then multiply by 100.
If you paid for 500 placements and only 340 are live, your compliance rate is 68%. You just funded a 32% failure rate.
That gap is not a rounding error. It is lost revenue your brand already paid to generate.
Key Secondary Display KPIs
Placement rate — displays confirmed live vs. total contracted stores
Correct location rate — display placed in the agreed spot, not a random aisle
On-time rate — display live before the promotional window opens
Condition score — display intact, stocked, and undamaged at audit
Duration compliance — display stays up for the full contracted period
Measuring Compliance Across Locations
Manual store audits work, but they are slow and expensive at scale.
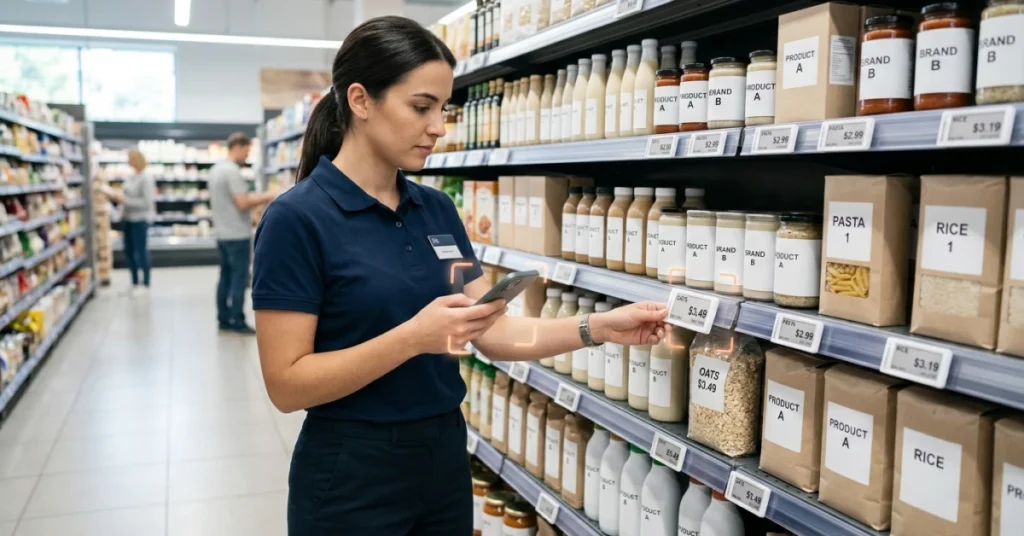
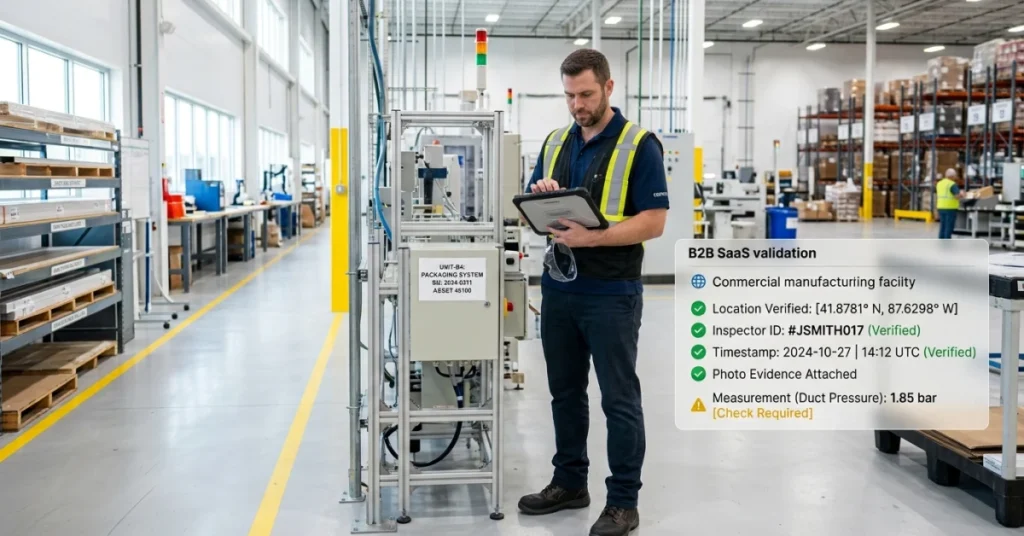
Photo-verification tools let field reps snap a timestamped image. That cuts audit time sharply and creates a hard record that a display was live on a specific date.
Brands using image recognition for compliance can verify hundreds of locations in the time a manual team checks a dozen.
Speed matters. A display that goes up three days late misses the peak traffic window entirely.
Tracking Promotional Performance
Compliance data only becomes powerful when you pair it with sales data.
Stores with verified displays consistently outsell non-compliant ones. Retail studies show compliant locations drive up to 25% higher lift during a promotion (Nature).
That comparison — compliant store vs. non-compliant store — is your clearest proof of what the display is worth.
Research on parallel execution display programs shows brands that track this gap fix it faster. They recover lost revenue within the same promotional cycle (Researchgate).
📊 By the Numbers
Brands with verified display compliance see up to 25% higher in-store sales lift vs. non-compliant locations.
Winning at retail is not about the best-looking display. It is about proving, store by store, that the display was actually there.
Conclusion
That compliance rate formula is more than a metric. It is the moment brands stop guessing and start knowing.
Codeinstitute found that structured secondary data tracking can improve decision accuracy by up to 40%. Brands without a tracking system are flying blind on nearly half their calls.
Most brands pour budget into creative. They lose the war in the stockroom — that is the real cost of poor execution.
Statista data shows retail engagement drops sharply when in-store execution misses the mark. A display no one sees is a display that never existed.
Understanding promotional display ROI starts with knowing your compliance rate — not your design budget.
Missed compliance is the silent drain no creative brief ever fixes. FieldPie gives field teams real-time photo checks and custom audit forms. Every contracted display gets confirmed on the floor — not assumed.
Start treating execution as seriously as creative. Your multi-display execution window becomes a measurable revenue driver — not a hope.