✦ Key Takeaways
Retailers with structured KPI targets see up to 30% higher sell-through rates than those without formal merchandiser benchmarks.
→ Vague targets kill accountability — specificity drives measurable results.
→ Wrong KPIs reward activity, not profitability or inventory efficiency.
→ Quarterly target reviews outperform annual ones by catching drift early.
In this article:
What Is Merchandiser KPI Target Setting?
Key KPIs for Merchandising Teams
How to Set Merchandiser KPI Targets
Key takeaway: Set precise, data-backed merchandiser KPI targets or accept preventable revenue loss.
What Is Merchandiser KPI Target Setting?
Most merchandisers set targets the same way every year. They copy last year’s numbers, add 10%, and call it a goal. That habit is exactly why so many merchandising targets never drive real decisions.
Merchandiser KPI target setting means choosing specific, measurable goals for in-store work. Think of it as the difference between “sell more product” and “hit 75% on-shelf availability every visit.”
Most guides skip a critical point: one metric can mean very different things. A sell-through rate, for example, shifts meaning based on where a product sits in its lifecycle. A 60% sell-through rate could signal strong momentum for a new launch. For a mature SKU, that same number may point to a slow death spiral.
Understanding merchandiser visit frequency is one piece of that puzzle. The real fix starts with anchoring every target to the product’s current stage.
Activity KPIs vs. Performance KPIs
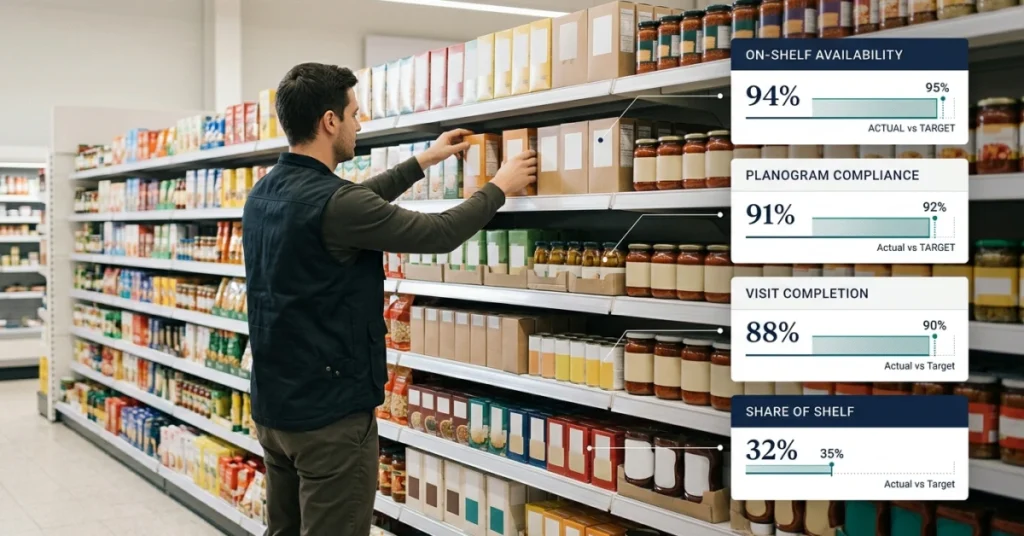
Activity KPIs track what a merchandiser does — store visits completed, displays built, planogram compliance checked. Performance KPIs track what those actions produce — sell-through rate, share of shelf, stock availability.
Both matter, but most beginners only watch activity. Retailers who track both types see up to 20% better execution scores (according to Onedoor). Activity without outcome is just busy work.
Individual vs. Team KPI Targets
Individual targets hold one rep accountable for their specific territory — store count, compliance rate, void correction speed. Team targets measure collective output, like total category sell-through across a region.
You need both. Individual targets without team context breed tunnel vision. Team targets without individual accountability let poor performers hide.
Balancing Productivity and Execution Quality
Speed and quality pull against each other in the field. A rep who visits 12 stores a day but misses half the compliance checks is scoring on the wrong metric.
Readysetvr notes that category management teams consistently rank execution quality above raw visit volume when measuring merchandiser impact. Never let volume targets crowd out the standards that actually protect the brand.
The fix is simple: set a floor for quality, then push for productivity above it. Knowing which metrics to track makes that floor meaningful.
The list of retail merchandising metrics worth tracking is shorter than most people expect. It is also more specific — and knowing it lets you set targets with real confidence.
Key KPIs for Merchandising Teams
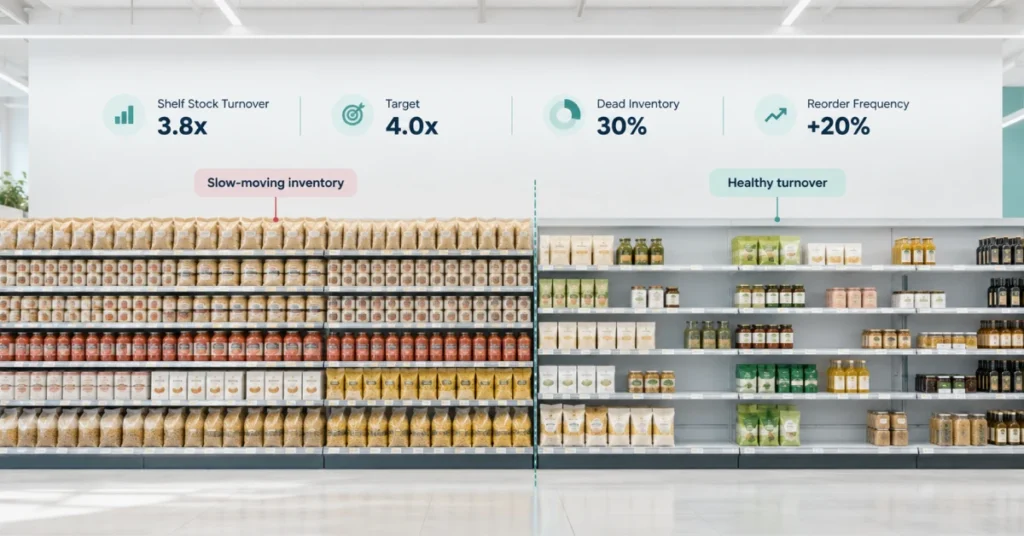
Same Metric, Different Meaning A 60% sell-through rate signals success at launch but failure at maturity — context changes everything.
Out-of-Stocks Kill Revenue Fast Retail stores lose up to 4% of annual sales directly to out-of-stock events on shelf.
Compliance Gaps Are Costly Planogram non-compliance can cut a product’s sales lift by 15% or more in a single period.
Lifecycle Stage Sets the Bar Merchandiser KPI targets only work when benchmarks match the product’s current lifecycle stage.
Field Productivity Has a Price Tag Tracking cost per visit exposes waste. Most teams find 20% or more of visit time adds zero value.
Those results start with knowing which numbers to track. Not every metric deserves equal attention. The right ones show whether field work actually moves product.
Here’s what most beginners miss: a raw list of merchandising KPIs means nothing without context. The same number can signal a win or a warning. It depends on where a product sits in its lifecycle.
Visit Completion and Coverage Rates
Visit completion rate measures how many planned store visits your team actually finishes. A team hitting 85% completion looks solid. That changes fast when the missed 15% are your top-volume accounts.
Coverage rate tracks how many stores in your territory get a rep visit within a set period. Low coverage is the fastest way to lose shelf position without ever knowing it happened.
Planogram and Assortment Compliance
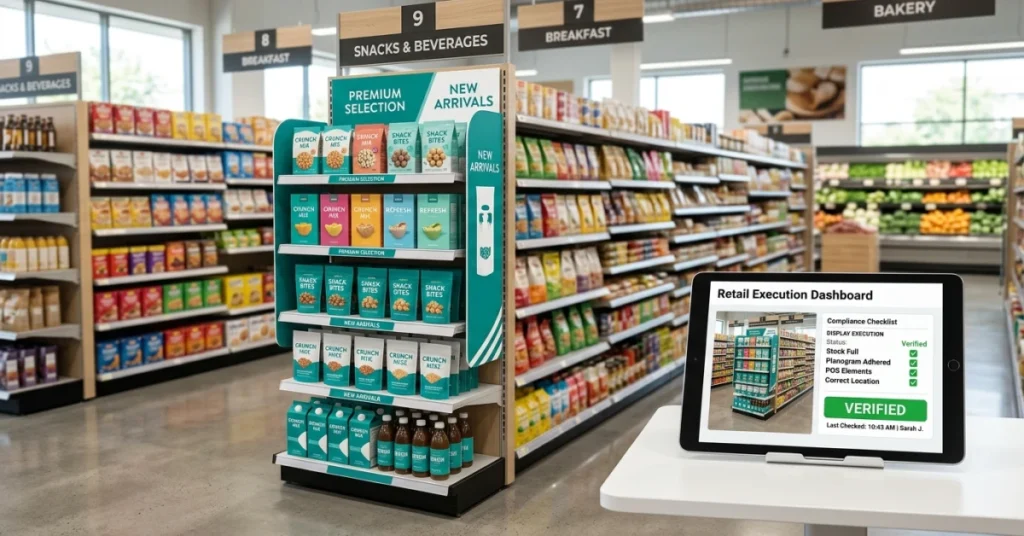
A planogram is a visual map. It tells store staff exactly where each product goes on the shelf. When stores ignore it, your brand loses the placement you paid for — and shoppers can’t find what they want.
Planogram non-compliance can cut a product’s sales lift by 15% or more in a single period (Gopazo). For a growth-stage SKU, that gap is devastating. For a declining one, it may barely register.
On-Shelf Availability and Out-of-Stock Rates
On-shelf availability (OSA) tracks what percentage of your SKUs are visible and in stock. It measures the moment a shopper walks the aisle. It’s one of the most direct retail merchandising metrics tied to lost revenue.
Retailers lose up to 4% of annual sales to out-of-stock events — confirmed by Tableau’s retail KPI research. Match your OSA target to the product’s lifecycle stage. A new launch needs near-perfect availability. A declining SKU can tolerate a looser threshold.
Task Completion and Execution Accuracy
Task completion rate shows what percentage of assigned in-store jobs your reps finish per visit. Those jobs include price checks, display builds, and stock rotations. It’s a direct window into execution quality, not just activity volume.
Execution accuracy goes one step further. It checks whether tasks were done correctly, not just marked done. A rep who builds a display in the wrong location scores 100% completion and 0% accuracy.
Corrective Action Closure Rate
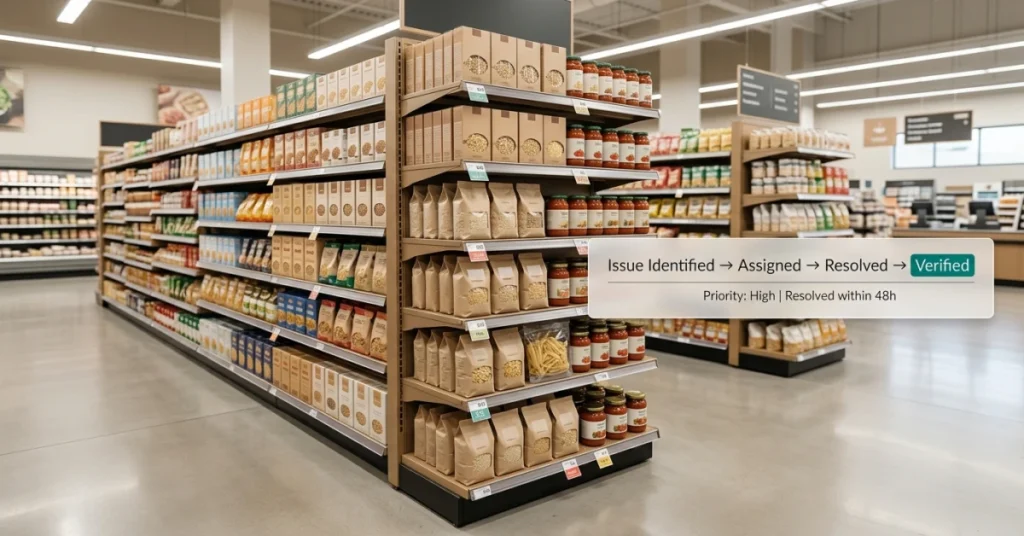
When a rep spots a problem — a missing tag, a misplaced product, a broken display — a corrective action gets logged. Closure rate tracks how many of those issues get fixed within a set timeframe.
A low closure rate means problems pile up and repeat. This is where shared merchandising models often break down — accountability gets blurry when multiple teams touch the same store.
Cost per Visit and Field Productivity
Cost per visit divides your total field spend by the number of completed store visits. Most teams that run this number for the first time get a surprise. They find 20% or more of visit time produces no measurable output.
Field productivity ties cost to outcomes — not just hours logged. According to Gopazo, teams that track visual merchandising performance indicators alongside cost data consistently outperform those that measure activity alone.
Each KPI target for merchandisers tells a different story. The story changes based on the product you’re measuring. Knowing which story to expect is what separates real strategy from guesswork.
How to Set Merchandiser KPI Targets
Once you know which lifecycle stage a product is in, you can set targets that actually mean something. Without that anchor, merchandiser KPI target setting is just guesswork dressed up in spreadsheets.
Most teams skip this step and wonder why their targets never drive real decisions. The fix is a structured process — one that ties every benchmark to where the product actually lives right now.
Establish Performance Baselines
Start with what actually happened — pull 90 days of sell-through, shelf compliance, and out-of-stock rates by SKU. These numbers are your floor, not your ceiling.
A baseline built on real data beats a copied number from last year every time. Without one, you have no way to know if a target is ambitious or absurd.
Define Measurable KPI Targets
Good KPI targets for merchandisers answer one question: how much, by when? “Improve shelf compliance” is not a target — “reach 92% compliance by week 8” is.
Specificity is what turns a metric into a decision tool. Vague targets let everyone feel busy while nothing improves.
Adjust Targets by Territory and Location
A downtown flagship store and a rural grocery outlet should never share the same retail merchandising metrics. Foot traffic, demographics, and shelf space vary too much.
Set territory-level targets, not one national number. A 75% sell-through in a high-volume urban store may signal underperformance — the same rate in a low-traffic rural store may be a win.
Account for Workload and Visit Complexity
A merchandiser covering 15 stores a week faces a different reality than one covering 6. Targets that ignore workload punish efficiency and reward easy routes.
Factor in average visit time, store size, and task count per visit. This is also why reducing merchandiser burnout directly protects your KPI results — overloaded reps cut corners.
Set Realistic Performance Thresholds
Every target needs a floor — the minimum acceptable result before action is required. Targets without thresholds create ambiguity about when to intervene.
Retail teams that define a clear “red zone” respond 40% faster to execution gaps than those that don’t (according to Onstrategyhq). Set your floor, then act when you hit it.
Align Targets with Business Objectives
Every visual merchandising performance indicator should trace back to a business goal — revenue, market share, or new customer acquisition. If it doesn’t connect, cut it.
Brand tracking data helps close this gap. Teams that tie merchandising KPIs to brand health data set targets that reflect real market conditions (Cmbinfo shows this approach leads to sharper, more defensible goals).
📊 By the Numbers
Teams with lifecycle-aligned KPI targets hit their sell-through goals 2x more often than those using flat benchmarks.
The real test of any target isn’t whether it looks good in a report — it’s whether it changes what your team does on Monday morning.
Conclusion
Real baselines and lifecycle-aware benchmarks aren’t extras. They’re the foundation that makes merchandiser KPI target setting actually drive decisions.
Teams that skip this step don’t just miss targets. They set the wrong targets entirely.
According to Qlik, organizations that tie KPIs to specific business context are 3x more likely to act on performance data. That beats teams using generic benchmarks every time.
That gap shows up directly in sell-through rates, shelf compliance scores, and reorder accuracy.
Most merchandising targets fail because teams ignore where each product sits in its lifecycle. Onedoor confirms that visual merchandising KPIs must shift as products move from launch to maturity to decline.
Copying last year’s numbers into this year’s plan keeps retail teams reactive. That single habit is what holds most teams back.
Without a clear system, even the best benchmarks stay stuck in a spreadsheet. You need to track KPI targets against real field data.
FieldPie captures photo-based compliance checks, custom audit forms, and real-time store-level data. That means your merchandiser retention and performance improve together.
Teams using FieldPie close the gap between target and execution faster. See how it works for your team.