✦ Key Takeaways · 6 min read
Planogram compliance validation is booming. It grew from USD 532.2 million in 2022 and is projected to reach USD 1,648.5 million by 2030.
→ Manual shelf audits consistently miss errors that cost retailers dearly.
→ Computer vision catches compliance gaps faster than any human team.
→ Rolling out digital validation store-wide demands a phased, structured approach.
In this article:
Why Manual Audits Can’t Keep Up With Modern Shelves
How Computer Vision Validates Planogram Compliance in Real Time
The 5 KPIs That Actually Measure Compliance Accuracy
How to Roll Out Digital Validation Across Hundreds of Stores
Measuring ROI Before You Buy a Platform
Conclusion
Key takeaway: Retailers who automate planogram compliance now will dominate shelf execution permanently.
Why Manual Audits Can’t Keep Up With Modern Shelves

Why Manual Audits Can’t Keep Up With Modern Shelves
Picture a store manager walking the floor with a clipboard, checking whether every product sits in its assigned spot. That snapshot is already outdated by the time it’s filed. Detection latency is what actually costs retailers money, not detection accuracy. Manual audits are built in a way that guarantees they fail on that measure.
A planogram is simply a visual map that tells stores exactly where each product should sit on a shelf. When a product moves out of place, a shelf gap opens. Every hour that gap goes undetected, you lose sales, confuse shoppers, and drift further from the strategy your buyers negotiated.
The Hidden Cost of Compliance Gaps
Say your team checks each store once a week. A product gets misplaced on Monday, but no one flags it until Friday’s walkthrough. That’s four days of lost visibility, misrouted shoppers, and revenue quietly bleeding out.
The problem isn’t a one-time event; it compounds across every aisle, every store, every week. Digital planogram compliance validation exists because that weekly cycle is too slow for shelves that change daily. A digital shelf compliance guide can show you how much ground manual methods lose between visits.
How Digital Validation Differs From Manual Auditing
Manual audits rely on one person’s eyes, a paper form, and a schedule. Automated shelf-checking tools use cameras and algorithms to scan continuously, flagging issues in minutes rather than days. Research cited by Fieldpie shows that AI-powered retail analytics can cut audit cycle times by up to 80% compared to manual methods. That frees field teams to focus on selling instead of counting.
The real shift isn’t just speed, it’s what speed makes possible. A computer vision system spots a shelf gap right away. Your team can fix it before any shopper walks past an empty or misplaced product. That’s the difference between a record of what went wrong and a result that never went wrong at all.
Consider what it means if your current process can’t flag a breach until days after it happens. Closing that window to minutes isn’t a technical luxury; it’s the standard your shelves already need.
How Computer Vision Validates Planogram Compliance in Real Time
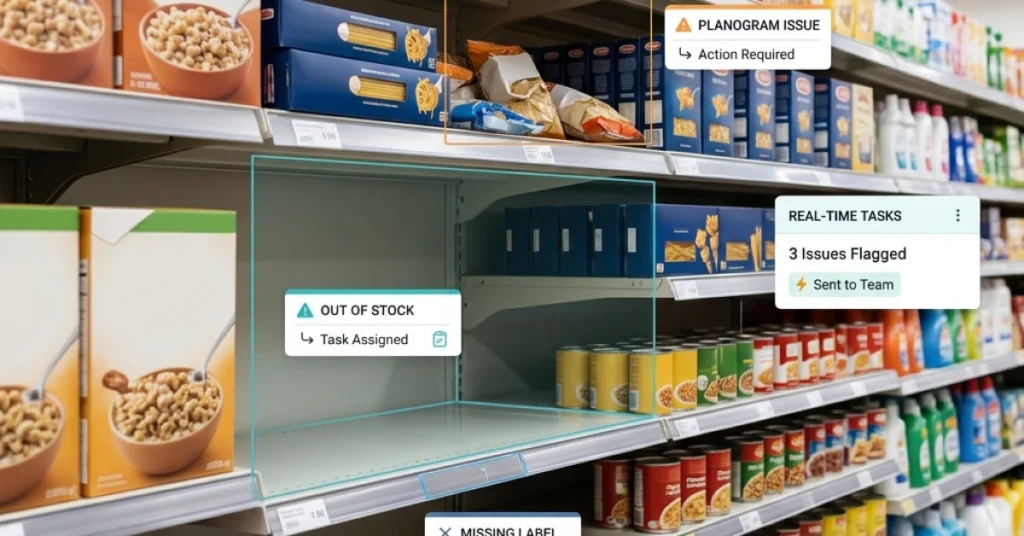
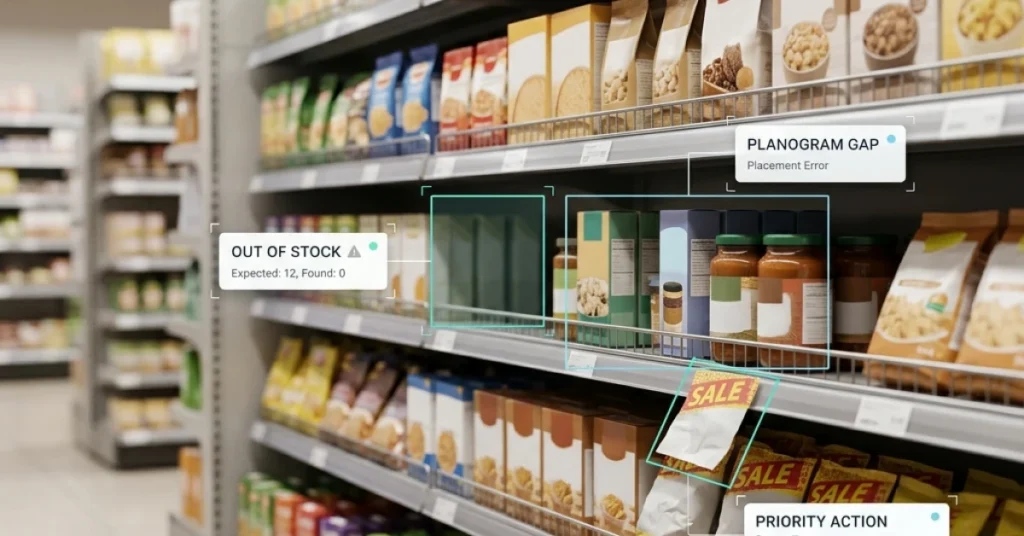
Computer vision shrinks the time between a shelf going wrong and a store associate getting a fix-it alert. Manual audits simply can’t match that speed. The technology reads the shelf and compares what it sees to the approved digital shelf planogram. It flags every deviation before the next customer walks down that aisle.
Think of it like a quality inspector who never blinks or takes a lunch break. That inspector can check every facing on every shelf in seconds. That’s what automated planogram compliance looks like in practice. The speed isn’t a nice bonus, it’s the entire point.
From Shelf Photo to Compliance Score
A planogram verification system turns a raw shelf image into an actionable compliance score in three tightly linked steps. Each step hands off to the next in near real time. That keeps the gap between capture and corrective action as short as possible.
Step 1: Image Capture at the Shelf Edge
A camera, either fixed above the shelf or mounted on a handheld device, captures a high-resolution image of the full shelf bay. Some retailers use ceiling-mounted cameras that shoot on a schedule. Others equip store associates with smartphones that upload photos directly to the planogram compliance software.
Step 2: AI Product Detection and Matching
The system’s AI scans each product facing, reads barcodes or packaging visuals, and matches every item to a master product database. This is where computer vision planogram compliance earns its speed advantage over a clipboard. A well-trained model can identify hundreds of SKUs in a single image without slowing down.
Step 3: Deviation Flagging Against Planogram Data
Once products are identified, the system overlays the detected shelf layout against the approved planogram. Any mismatch, a wrong product, a missing facing, or an item in the wrong slot, triggers an alert. The store team gets a specific task: fix shelf bay three, position four, right now.
Say your team captures shelf images every two hours. A misplaced product that would have survived a full week between manual audits now gets caught and corrected the same morning. That’s the detection speed advantage that digital planogram compliance validation delivers over any paper-based process.
How Few-Shot Learning Handles New SKUs
New products hit shelves constantly, and a system that can’t recognize a new SKU is useless on launch day. Few-shot learning solves this by training the model on just a handful of product images instead of thousands. You add a new item to the database and upload five or six photos of its packaging. The system can then spot it on the shelf within hours.
Most retailers rotate SKUs far faster than any manual training process can keep up with. A planogram verification system built on few-shot learning stays current without a weeks-long retraining cycle every time a product changes.
📊 By the Numbers
ResNet101 and FAN-based Transformer models achieved 99.86% accuracy on real-world retail datasets, per Pmc Ncbi Nlm Nih, indicating strong model stability.
That 99.86% accuracy figure is genuinely strong, yet detection precision alone doesn’t protect a retailer’s revenue. A system that catches every breach but delivers the alert four days late still costs sales. Knowing which metrics prove your system is fast enough separates a working rollout from an expensive shelf ornament.

The 5 KPIs That Actually Measure Compliance Accuracy
That always-on precision is only useful if you’re measuring the right things. Most teams deploy planogram compliance software and then track a single number: overall compliance rate. That one number hides more than it reveals.
The real question isn’t whether a shelf was compliant at the moment of audit. Detection latency, meaning how many minutes or hours pass between a breach and a fix, is what separates teams that recover fast from teams that just document failure. A shelf that’s wrong for four hours costs far more than one that’s wrong for four minutes.
Compliance Rate vs. On-Shelf Availability
Compliance rate tells you what the shelf looked like at a snapshot in time. On-shelf availability tells you what a shopper actually found when they reached for a product. These two numbers can move in opposite directions, and when they do, compliance rate is the one lying to you.
A planogram verification system that tracks both metrics together gives you a clearer picture. If compliance is high but availability is low, the approved planogram itself may be the problem, not the execution.
Linking KPIs to Out-of-Stock Reduction
Automated planogram compliance tools generate alerts, but alerts only matter if someone acts on them fast. Track mean time to resolution alongside breach frequency, and you’ll quickly see which stores have an execution problem versus a staffing problem.
A study found that only 57.4% of brands measure planogram compliance at all, according to Omnishelf, which means most retailers are trying to reduce out-of-stocks without a baseline to measure against. You can’t cut what you don’t count.
📊 By the Numbers
Only 57.4% of brands measure planogram compliance at all, per Omnishelf.
Getting the right KPIs in place is only half the battle. The harder challenge is making sure every store in your network actually runs the process the same way, every single day.
How to Roll Out Digital Validation Across Hundreds of Stores

How to Roll Out Digital Validation Across Hundreds of Stores
Knowing that detection latency is your real problem is one thing. Building a system that catches breaches fast across hundreds of locations is another. Most rollouts fail not because the technology is wrong, but because stores aren’t set up to act on what the system finds.
Start with a pilot group of ten to twenty stores before you scale. Pick locations that represent your hardest conditions: high traffic, frequent resets, and mixed staff experience. Use that pilot to set your baseline detection-to-correction time. Make that number the target every new store must hit before you move on.
ERP and Retail System Integration Requirements
Digital planogram compliance validation only creates value when it connects directly to your inventory and task management systems. If a camera flags an empty shelf but the alert sits in a separate app your team never opens, the breach stays unfixed. Wire your planogram verification system into the tools store associates already use. That might be a task app, a messaging platform, or your ERP’s replenishment queue.
Map the data flow before you buy anything. Know exactly which system owns the correction task, who receives the alert, and how completion gets confirmed. A digital field audit framework can help you document that workflow so nothing falls through the cracks during rollout.
Deployment Models: Fixed Camera vs. Mobile App
Fixed cameras give you continuous shelf scanning with no dependence on staff behavior. That makes them the stronger choice for high-velocity categories where a gap can cost you sales within hours. Mobile app models cost less to deploy and work well for lower-frequency audits.
The trade-off with mobile apps is that they put human scheduling back into the process. That adds the same latency you’re trying to eliminate. Computer vision planogram compliance works best with fixed cameras in your top-volume stores and a mobile app as a backup layer for smaller locations.
Automated planogram compliance at scale means choosing the right model for each store tier, not forcing one solution everywhere. 7-Eleven Philippines moved to continuous shelf scanning across more than 4,500 stores. That shift to always-on monitoring produced 35% better planogram compliance alongside meaningful sales growth.
📊 By the Numbers
7-Eleven Philippines moved to continuous shelf scanning across 4,500+ stores. The result was 35% better planogram compliance and 1.7× like-for-like sales growth, per Omnishelf.
Before you commit to any platform, don’t just ask whether it detects breaches accurately. Ask whether you can calculate, in dollars, what faster detection is actually worth to your business.
Measuring ROI Before You Buy a Platform
Set Your Benchmark First Lock in a detection-to-correction time before you evaluate any vendor’s demo.
Latency Beats Accuracy Every Time A fast correction on a flagged breach creates more value than a perfectly accurate report nobody acts on.
Demand a Live Workflow Test Ask vendors to show how a detected breach moves from alert to resolved action, not just how it gets flagged.
Pilot Data Is Your Leverage The benchmark you set in your toughest stores becomes the contractual standard you hold vendors to.
That benchmark number you locked in during the pilot isn’t just an internal target. It’s the most powerful tool you have when a vendor sits across the table from you.
Most buyers evaluate planogram compliance software by asking about accuracy rates. That’s the wrong question. Accuracy tells you how often the system spots a problem, but it says nothing about how fast your team fixes it.
Detection latency is the metric that actually moves revenue.
Baseline Metrics to Capture Pre-Implementation
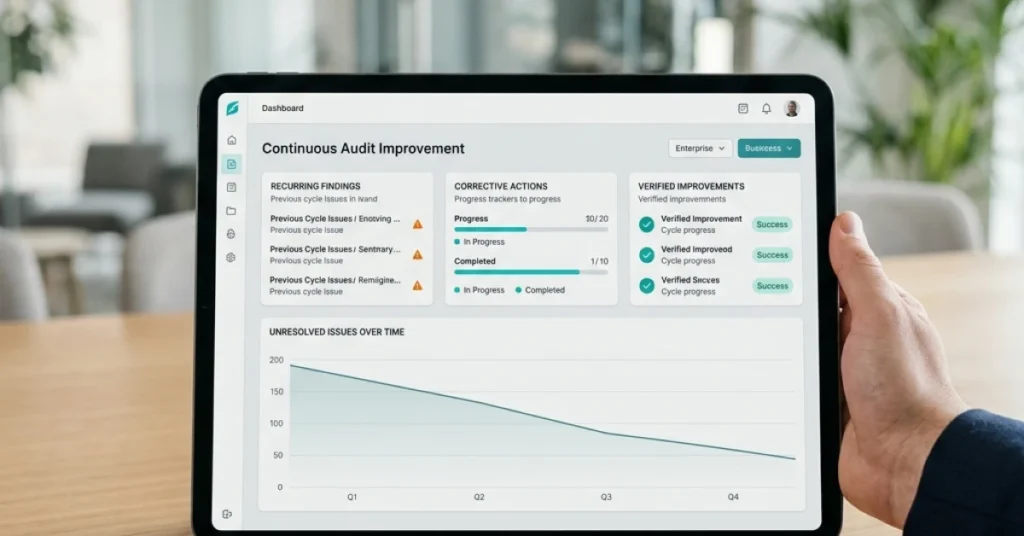
Before you sign anything, measure three things in your current operation: how long a compliance breach goes undetected, how long it takes to correct after someone notices, and how often the same breach repeats in the same location.
Say your team currently catches a misplaced product within six hours on average and fixes it within two more. That’s your baseline. Any platform you buy must beat both numbers, not just one of them.
Time to detect: How many hours pass before a breach is flagged?
Time to correct: How long from alert to shelf fixed?
Audit coverage: What percentage of SKUs get checked per visit?
“The platform that wins your contract should reduce detection latency first, correction time second, and repeat breach rate third. In that order.”
AI Accuracy vs. Human Auditor Benchmarks
Vendors love to lead with accuracy scores because those numbers look impressive in a slide deck. Push past that and ask how the system handles SKU data at scale.
A strong digital planogram compliance validation platform pulls product images and specs from a verified asset library, so your team isn’t hunting down dimensions before an audit can even start, as Visiongroupretail notes for systems that maintain over 1.3 million verified SKUs. That kind of infrastructure is what separates a real automated planogram compliance tool from a glorified photo app.
Human auditors catch roughly what they can see on a scheduled visit. A computer vision planogram compliance system runs continuously, so the comparison isn’t accuracy, it’s coverage over time. Ask vendors to show you audit frequency per store, not just per visit.
|
Evaluation Criteria |
What to Ask the Vendor |
Red Flag Answer |
|---|---|---|
|
Detection latency |
How fast does a breach trigger an alert? |
“It depends on audit schedule.” |
|
Correction workflow |
Who gets notified and how? |
“We send a report to your manager.” |
|
SKU data source |
Where do product images and specs come from? |
“You upload them manually.” |
|
Repeat breach tracking |
Can you see if the same shelf fails twice? |
“That’s a custom report request.” |
FieldPie approaches this differently from standard audit tools. Its planogram verification system connects detection directly to field task assignment, so the alert and the corrective action move through one platform rather than two separate tools your team has to juggle.
Run a live scenario test before you commit. Give the vendor a real breach from your pilot data and time how long it takes for the system to flag it, route the task, and confirm the fix. That single test tells you more than any accuracy benchmark ever will.
Once you know what good looks like in numbers, the only question left is whether you’re ready to make it the standard across every store you run.
Conclusion
Once you’ve locked in your pilot benchmark as the contractual standard, the real work shifts from evaluation to execution. Detection latency is what separates a planogram verification system that looks good in a demo from one that actually protects shelf revenue. Catch a facing violation in four hours instead of four days, and you get a structurally different business outcome. That’s not a marginal gain, it’s a different business.
Most retailers who invest in automated planogram compliance still measure success by accuracy scores. Accuracy without speed is just a prettier version of the old clipboard audit. The computer vision planogram compliance tools worth deploying are the ones that close the gap between a breach and a fix. Finding the breach matters, but fixing it fast is what protects revenue.
Manual shelf audits create a compliance gap that grows every hour a violation sits uncorrected. FieldPie’s digital planogram compliance validation flags shelf breaches in real time. It then routes correction tasks directly to field reps through its mobile audit tools. FieldPie sells an AI-powered field operations platform that helps businesses manage scheduling, routing, audits, sales, merchandising, and team tracking from a single mobile-friendly tool.