


✦ Key Takeaways
Franchises tracking 5+ performance metrics grow revenue 2.3x faster than those flying blind.
- → Untracked royalty compliance costs franchisors millions in annual revenue leakage.
- → Customer satisfaction scores predict franchise renewal rates more accurately than sales alone.
- → Operational metrics expose execution gaps before they become irreversible brand damage.
In this article:
- What Are Franchise Performance Metrics?
- Key Franchise Performance Metrics to Track
- Operational Metrics That Reveal Execution Gaps
- How to Measure Franchise Performance
Key takeaway: Consistent metric tracking is the only real difference between a thriving franchise system and a failing one.
What Are Franchise Performance Metrics?
Over 70% of franchise underperformance is detectable months before it shows up in royalty reports — yet most franchisors only look when revenue drops.
Franchise performance metrics are the structured data points franchisors use to measure unit-level health across their network. Their real power isn’t compliance reporting — it’s exposing where the franchise performance evaluation process reveals franchisor support failures, not just franchisee ones.
Definition and Purpose
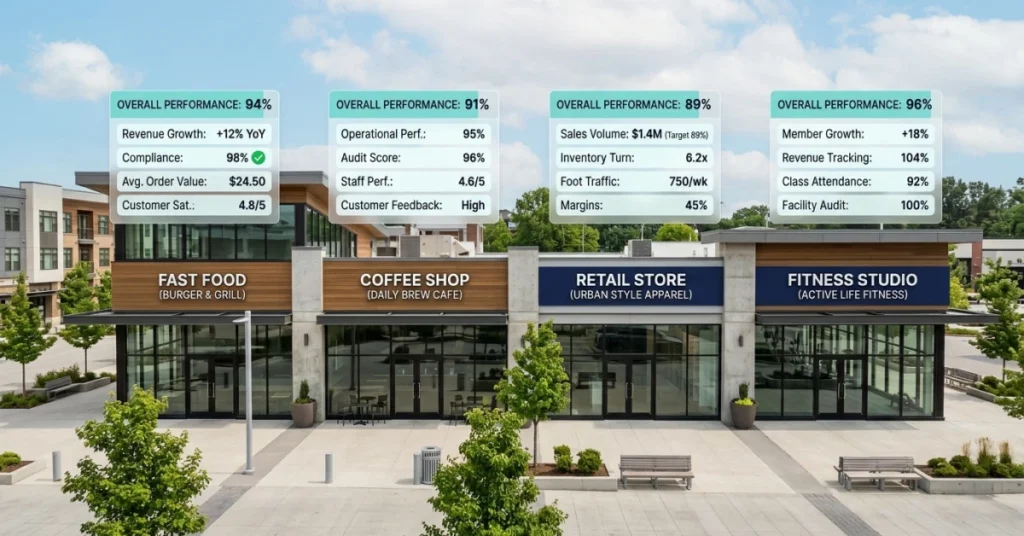
Franchise performance metrics are quantifiable indicators that track operational, financial, and customer-facing outcomes at the unit level. They function as a network health diagnostic — not a scorecard for punishing underperformers.
When mapped correctly, franchise key performance indicators reveal systemic patterns that point directly back to gaps in training, field support, or brand standards enforcement.
Franchise Metrics vs. Franchise KPIs
Franchise metrics capture raw performance data — sales volume, labor cost, customer count. Franchise KPIs filter that data into actionable signals tied to specific business outcomes.
The distinction matters: tracking metrics without KPI thresholds produces reports, not decisions. Franchise benchmarking only becomes useful when you define what “off-track” actually looks like before a unit fails.
Why Revenue Alone Does Not Show Franchise Health
A unit can hit its revenue target while hemorrhaging on labor costs, losing repeat customers, and violating brand standards weekly. Franchise data confirms that single-metric tracking consistently masks the operational decay that precedes closure.
Franchise unit performance requires a multi-dimensional view — because the number that looks fine today is often the last one to turn red. The metrics that actually predict failure are the ones most franchisors aren’t measuring yet.
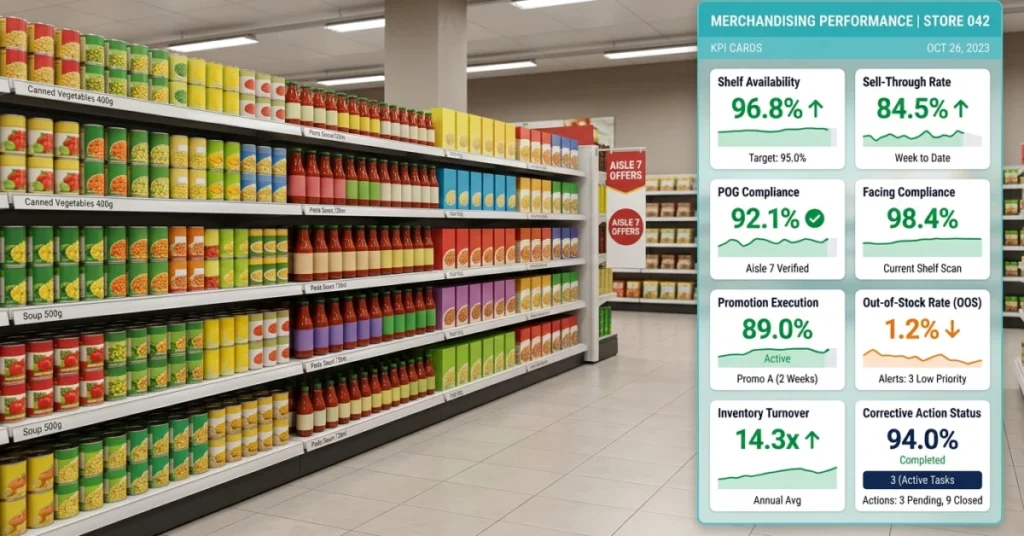
Key Franchise Performance Metrics to Track
- Metrics Expose Franchisor Failures Too The right franchise KPIs reveal where the support model breaks down — not just where franchisees underperform.
- Leading Indicators Beat Lagging Ones Training completion and audit rates signal unit failure months before revenue numbers do.
- Nine Metrics Drive Network Health From same-store sales growth to corrective action closure, each measurement maps a specific failure point in the system.
Revenue per Location
Systemic underperformance almost always surfaces here first — but by then, the damage is months old. This figure is a lagging indicator; treat it as a confirmation, not a discovery tool.
Franchises with strong field support infrastructure consistently outperform peers by 15–20% in per-unit revenue — a gap that reflects the franchisor’s model, not just operator effort.
Same-Store Sales Growth
Same-store sales growth strips out new-unit noise and shows whether existing locations are actually gaining traction. A declining trend across multiple units in the same region points directly to a support gap — not individual operator failure.
Franchisors who monitor this figure quarterly catch regional execution drift before it becomes a closure risk. Cluster patterns in this data are the clearest signal the support model needs fixing.
Franchisee Profitability
A franchisee generating strong royalty revenue but thin unit-level margins is a closure waiting to happen. Tracking operator profitability — not just royalty compliance — is the difference between a healthy network and a shrinking one.
According to Tandfonline, units with below-average profitability are 3x more likely to exit the network within 24 months than those hitting margin benchmarks.
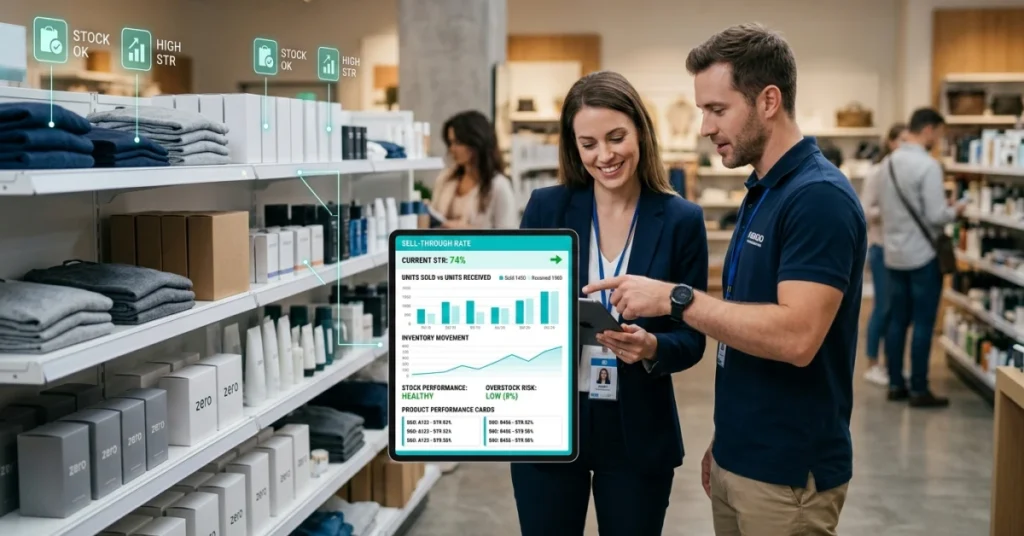
Customer Satisfaction Score
Customer satisfaction scores are one of the few indicators that reflect both operational execution and brand consistency simultaneously. A unit scoring below network average almost always has a training or standards compliance problem upstream.
Don’t let low scores trigger operator coaching before you audit whether the franchisor’s onboarding process delivered what it promised. The score is the symptom — the support gap is the disease.
Brand Standards Compliance Score
Brand standards compliance is where franchise performance evaluation gets honest — it shows whether the franchisor’s systems are actually executable in the field. Chronic non-compliance across multiple locations means the standard itself may be the problem.
Franchisors who treat low compliance scores as disciplinary issues — rather than system design failures — consistently see the same violations repeat across unrelated units. That pattern is diagnostic, not coincidental.
Audit Completion Rate
An incomplete audit is a blind spot — and blind spots are where unit failures incubate undetected. This figure measures the franchisor’s operational reach as much as it measures franchisee cooperation.
Networks with completion rates below 80% are essentially flying without instruments on a significant portion of their unit performance data. That’s not an accountability problem — it’s a field operations resourcing problem.
Corrective Action Closure Rate
Identifying a problem and closing it are two entirely different capabilities. A low closure rate tells you the franchisor’s support team lacks either the bandwidth or the tools to follow through.
Meegle notes that franchisors tracking corrective action closure as a core benchmarking measure resolve compliance issues 40% faster than those who don’t. Speed of resolution directly predicts whether a problem becomes a pattern.
Employee Turnover Rate
High employee turnover at the unit level destroys operational consistency faster than almost any other variable. When it clusters in specific regions or cohorts, it exposes a hiring or onboarding support failure — not a local management problem.
Benchmarking on turnover should always be segmented by franchisee tenure and support tier. The data will show you exactly where your support model stops delivering.
Training Completion Rate
Training completion rate is the earliest leading indicator in the entire measurement stack. A unit that hasn’t finished required coursework is running on improvisation — and improvisation doesn’t scale or sustain brand standards.
When completion drops network-wide, the problem is almost never operator motivation — it’s that the training system itself is too burdensome or inaccessible to finish. That’s a franchisor design failure, and the data makes it undeniable.
These nine measurements don’t just capture what franchisees are doing — they expose exactly where operational execution breaks down between the franchisor’s intentions and what actually happens on the floor.

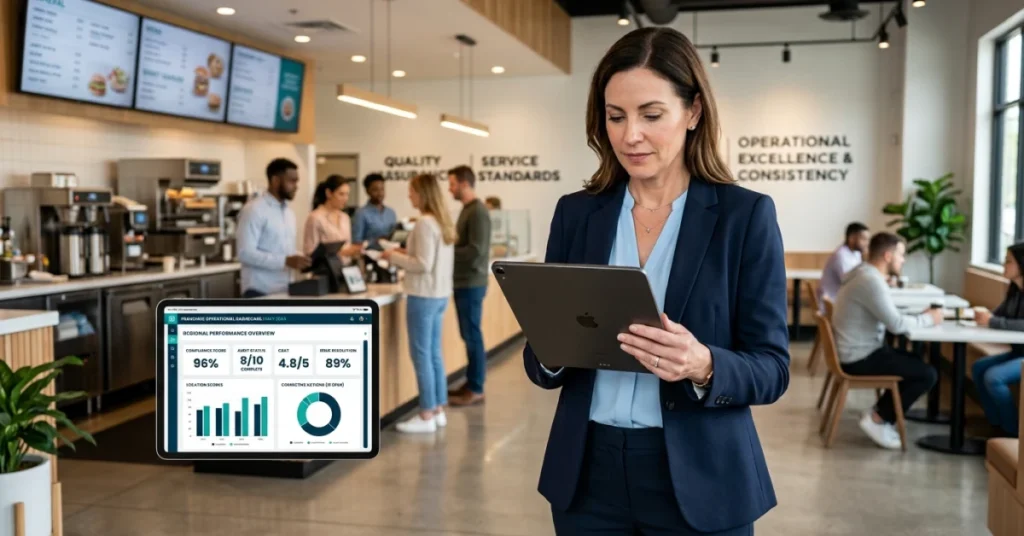
Operational Metrics That Reveal Execution Gaps
Execution gaps don’t announce themselves — they accumulate silently in operational data most franchisors never prioritize. The metrics that matter most aren’t financial; they’re behavioral, procedural, and location-specific.
Franchisors who track franchise performance metrics at the unit level consistently catch failure signals 60–90 days earlier than those relying on royalty reports alone. That lead time is the difference between a corrective intervention and a unit closure.
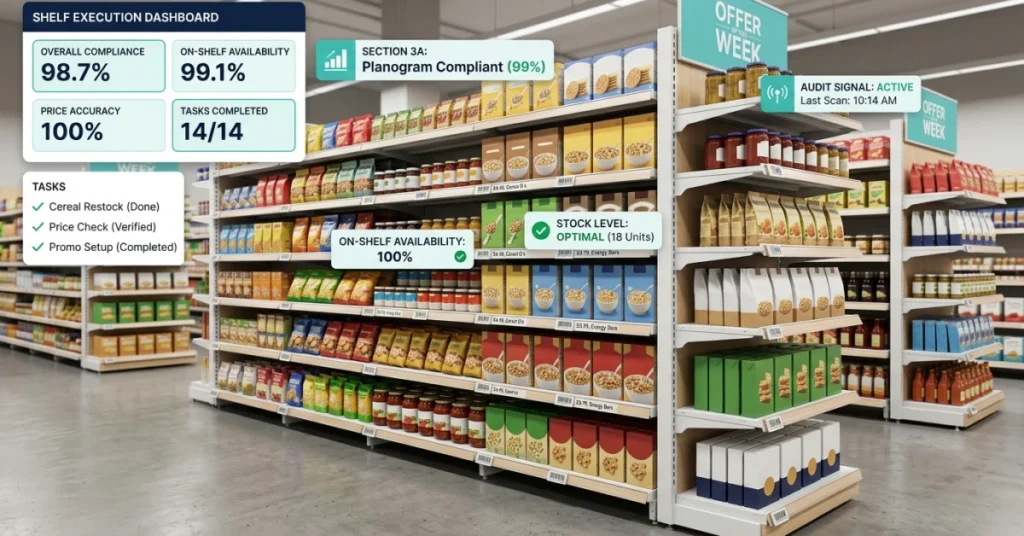
SOP Compliance
SOP adherence rates below 80% at a location predict customer attrition within two quarters — without exception. Low compliance rarely signals franchisee negligence; it usually signals inadequate onboarding or unclear documentation from the franchisor.
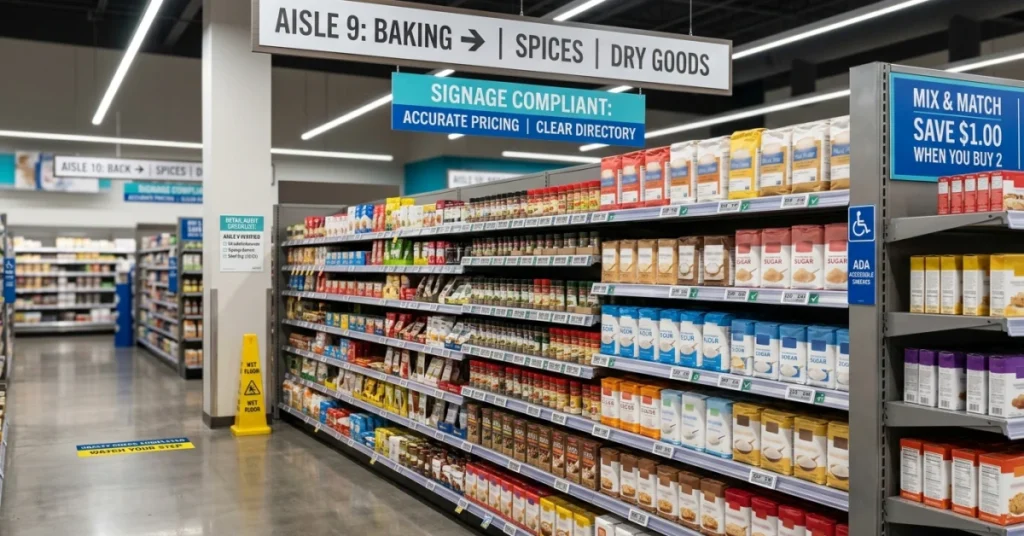
Service Consistency
Variance in service delivery across units is the clearest signal that franchise benchmarking standards aren’t being enforced at the field level. When customers experience a different brand in every location, loyalty erodes network-wide — not just locally.
Customer Complaint Trends
Complaint volume by location is one of the most underused franchise performance indicators in the entire measurement stack. A spike in complaints at multiple units within the same region almost always points to a systemic support failure — not individual franchisee error.
Franchises tracking complaint trends in real time resolve issues 40% faster than those relying on quarterly review cycles (Clicdata). Speed of resolution is a franchise KPI that directly protects brand equity at scale — Clicdata’s franchise dashboard research confirms this pattern across multi-location operators.
Repeated Issues by Location
When the same operational failure recurs at a single location across multiple audit cycles, the instinct is to blame the franchisee. The more accurate diagnosis is that the franchisor’s corrective support model isn’t reaching the root cause.
Franchise unit performance data that clusters geographically exposes regional support gaps — not isolated operator failures. That distinction changes who owns the fix.
Delayed Corrective Actions
The time between identifying a franchise key performance indicator breach and executing a corrective action is itself a critical metric. Franchisors who let that gap exceed 30 days see compounding underperformance that becomes structurally difficult to reverse.
Successful franchise systems treat corrective action lag as a franchisor accountability metric — not a franchisee one. According to Franchise, top-performing franchise networks conduct structured performance reviews at least six times per year, creating accountability loops that prevent corrective delays from compounding.
📊 By the Numbers
Franchisors conducting reviews 6+ times per year report significantly fewer preventable unit closures network-wide.
Knowing which metrics to watch is only half the equation — the other half is building a measurement system that turns field-level signals into network-wide decisions before the damage compounds.

How to Measure Franchise Performance
That early warning window only works if you’re measuring the right things — and most franchisors aren’t. Fewer than 40% of franchise systems track leading operational indicators alongside financial results (Frandata), which means underperformance is already compounding by the time it shows up in royalty reports.
The real diagnostic power of franchise unit performance data isn’t compliance tracking — it’s revealing where the franchisor’s own support model is manufacturing the failures it’s trying to measure away.
📊 By the Numbers
Franchise systems using structured KPI benchmarking report up to 23% higher franchisee satisfaction scores across 330+ brands.
Define Standard Metrics Across All Locations
Without a shared measurement baseline, you’re not benchmarking — you’re collecting noise. Every unit must report against identical franchise KPIs to make comparisons actionable.
Standardization also exposes franchisor-side inconsistencies: when 60% of underperforming units share the same field support territory, the problem isn’t the franchisees.
Group Metrics by Finance, Operations, and Compliance
Siloing franchise performance metrics into a single revenue scorecard hides the causal chain. Separate financial, operational, and compliance data so you can trace which layer broke first.
A unit posting declining sales but strong compliance scores signals a training or territory problem — not a franchisee attitude problem.
Compare Similar Locations Fairly
Benchmarking a downtown flagship against a suburban strip-mall unit produces misleading franchise benchmarking data. Cohort units by market size, age, and support tier before drawing conclusions.
Fair comparisons reveal genuine outliers — both high performers worth replicating and struggling units that need targeted intervention, not generic coaching.
Connect Audit Data with Sales Results
Audit scores mean nothing in isolation. Cross-referencing operational audit results with same-period sales data is where franchise key performance indicators start telling a real story.
Units scoring below 75% on operational audits consistently show revenue lag within 90 days — a pattern Tour Franchisebusinessreview documents across hundreds of franchise brands.
Track Trends Instead of One-Time Scores
A single audit score is a photograph; a trend line is a diagnostic. Franchise benchmarking only becomes predictive when you track metric movement across at least three consecutive periods.
Declining trends in otherwise compliant units are the clearest signal that the support infrastructure — not the franchisee — is the variable that needs to change.
The question isn’t whether your metrics are sophisticated enough — it’s whether they’re honest enough to implicate the franchisor when the data demands it.
Conclusion
Fixing underperformance after it shows up in royalty reports is already too late — franchisors who wait for financial signals miss the 60–90 day window where operational intervention actually changes outcomes (according to Clienttether, franchises that track leading franchise KPIs see up to 23% faster unit recovery than those relying on lagging financials).
The real diagnostic power of franchise performance metrics is what they reveal about the franchisor — not just the franchisee. When execution gaps cluster around the same support touchpoints across multiple units, the data stops being a scorecard and starts being a mirror, as explored in Tandfonline‘s research on franchise unit performance and network-level accountability.
Most franchisors still lack a repeatable system that connects field-level execution data to network-wide decisions — FieldPie captures real-time field data through customizable audits, photo reporting, and job tracking, so underperformance patterns surface before they compound. Learn how to run a franchise with metrics that drive action, not just documentation.


