


✦ Key Takeaways
Retailers tracking 5+ performance metrics see up to 20% higher revenue growth than those flying blind.
- → Wrong metrics cost stores thousands in missed revenue weekly.
- → Sales per square foot exposes hidden inefficiencies no gut feeling catches.
- → Real-time dashboards turn raw store data into same-day decisions.
In this article:
- What Are Retail Store Performance Metrics?
- Why Retail Store Performance Metrics Matter
- Which Retail Store Performance Metrics Matter Most?
- How Retailers Track Store Performance Metrics
Key takeaway: Retailers who measure the right indicators dominate; those who don’t slowly disappear.
What Are Retail Store Performance Metrics?
Most retailers are already drowning in data — yet over 60% still can’t explain why their revenue fluctuates week to week. The problem isn’t a lack of numbers; it’s tracking the wrong ones.
These quantifiable signals reveal how effectively a store converts traffic, inventory, and labor into profit. Understanding which indicators cause outcomes versus which merely report them is what separates useful measurement from noise.
Definition and Core Objectives
Retail KPIs are structured measurements that track store health across sales, operations, customer behavior, and inventory. Their core objective isn’t scorekeeping — it’s giving operators the leverage to act before problems compound.
According to Tableau, retailers who actively monitor key indicators see up to 20% faster identification of underperforming store segments. Speed of diagnosis is the real competitive advantage.
The Difference Between Sales Metrics and Operational Metrics
Sales figures like total revenue tell you what already happened — they’re the scoreboard, not the playbook. Operational signals like conversion rate and units per transaction are the levers that produced that score.
Retalon identifies this distinction as the core reason most measurement efforts stall — operators optimize what’s visible, not what’s causal. Understanding retail store operations fundamentals is what separates reactive managers from proactive ones.
How Retailers Use Performance Data for Decision-Making
High-performing operators organize business indicators into a cause-and-effect hierarchy — inputs at the top, financial outputs at the bottom. This structure forces the right question: which lever do I pull, not just which number dropped?
When conversion rate falls, a scorekeeper logs the loss — an active operator immediately audits floor staffing, product placement
Why Retail Store Performance Metrics Matter
Causal metrics don’t just describe your store — they expose exactly which operational inputs are failing to produce financial outputs. Retailers who treat retail store operations as a cause-and-effect system consistently outperform those who treat dashboards as scorecards.
Conversion rate, units per transaction, and traffic patterns are the levers — revenue per square foot is the result. Tracking only the outcome while ignoring those levers is why most stores can’t explain why revenue dropped, only that it did.
Structured measurement frameworks produce tangible gains — stores that actively monitor leading KPIs report up to 15% higher revenue per square foot than those relying on lagging indicators alone (according to Erply). The gap between knowing your numbers and understanding them is exactly where profit disappears.
How KPIs Impact Revenue and Operational Efficiency
Operational KPIs like conversion rate and basket size are direct inputs — not observations — into your revenue equation. Operators who manage these variables proactively reduce waste and increase margin without changing foot traffic at all.
The shift from scorekeeper to active operator starts when key performance indicators for retail are organized hierarchically — inputs first, outputs second. That structure turns a weekly report into a weekly decision.
Why Retailers Need Real-Time Store Visibility
Delayed data is a silent margin killer — by the time a monthly report flags a conversion drop, weeks of recoverable revenue are already gone. Thoughtspot reports that businesses using real-time analytics are 2.5x more likely to make same-week operational adjustments that protect margin.
Live retail performance tracking doesn’t just speed up reporting — it fundamentally changes what actions are even possible. Visibility without latency is what separates stores that react to problems from stores that prevent them.
📊 By the Numbers
Retailers actively tracking leading KPIs report up to 15% higher revenue per square foot than lagging-indicator-only stores.
The question isn’t whether your store has data — it’s whether you know which numbers are pulling the levers that actually move revenue.

Which Retail Store Performance Metrics Matter Most?
The levers that drive revenue aren’t mysterious — they’re measurable, but only if you’re tracking the right inputs, not just the outputs. Most retailers watch total sales and call it visibility; that’s scorekeeping, not operating.
These indicators only create value when organized into a cause-and-effect hierarchy — where retail store operations inputs like conversion rate and units per transaction are understood as levers that drive financial outputs like revenue per square foot. Retailers who invert this — chasing the output without controlling the input — are always reacting, never leading.
📊 By the Numbers
Retailers tracking leading operational KPIs see up to 20% faster response to underperformance than those monitoring revenue alone.
Sales Per Square Foot
Sales per square foot is the clearest financial output in retail — it tells you how efficiently your floor space generates revenue. Top performers average $325–$500 per square foot annually; underperformers often don’t know their own number.
This figure exposes layout inefficiencies, dead zones, and category misplacement that total revenue numbers completely hide. It’s the output — but conversion rate and basket size are what actually move it.
Conversion Rate and Average Basket Size
Conversion rate measures how many store visitors actually buy — a 1% lift can mean thousands in incremental monthly revenue. Average basket size tells you whether your merchandising and upsell tactics are working at the shelf level.
These two figures are the most direct operational levers a store manager controls daily. Ignore them, and sales per square foot becomes an unexplained number with no fix attached.
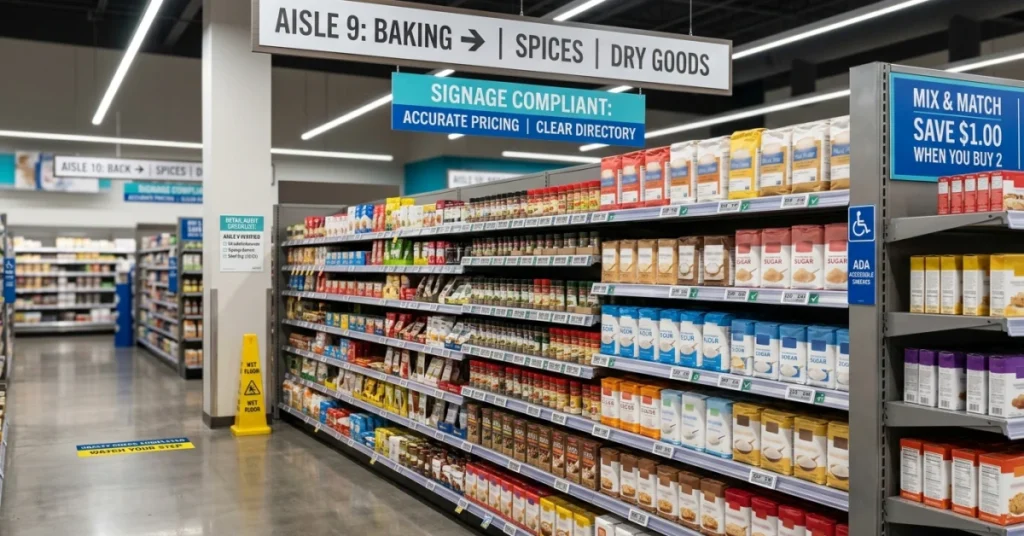
On-Shelf Availability (OSA) and Out-of-Stock (OOS) Rate
Out-of-stocks are silent revenue killers — brands lose an estimated $1 trillion globally per year to poor on-shelf availability (Spglobal, Retail KPI Guide). A shopper who can’t find what they came for doesn’t wait — they leave or switch to a competitor’s brand.
OSA directly suppresses conversion rate and basket size, making it a root-cause indicator, not a secondary one. Tracking OOS rate weekly is non-negotiable for any operation serious about sustained commercial performance.
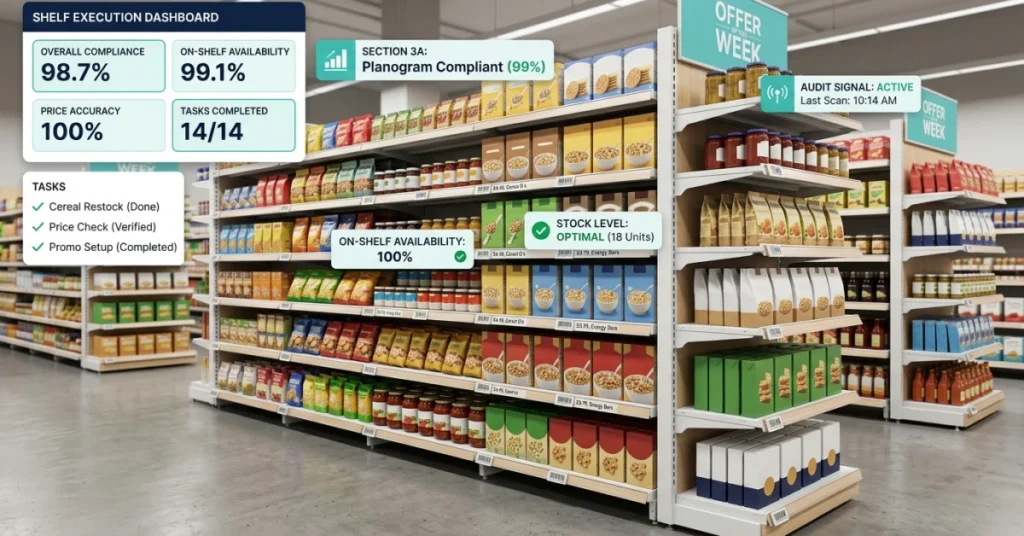
Planogram Compliance and Merchandising Performance
Planogram compliance determines whether your shelf strategy — built in a boardroom — actually exists on the floor. Non-compliance rates above 20% are common, and each deviation directly undermines the conversion and basket figures you’re trying to move.
According to Netsuite, merchandising execution is one of the most underdisciplined areas in store measurement frameworks — most brands audit it too infrequently to act on findings. Compliance isn’t a checkbox; it’s a revenue lever.
Employee Productivity and Visit Completion Rates
Field team output — measured by tasks completed per visit, visit completion rate, and time-on-shelf — directly determines whether operational plans ever reach the store floor. A perfect planogram means nothing if the rep didn’t execute it.
These measures bridge strategy and shelf reality. The question isn’t whether your team showed up — it’s whether the visit moved the numbers that move revenue.
Knowing which indicators matter is only half the equation — the other half is building the systems that capture, surface, and act on them before the week is already lost.
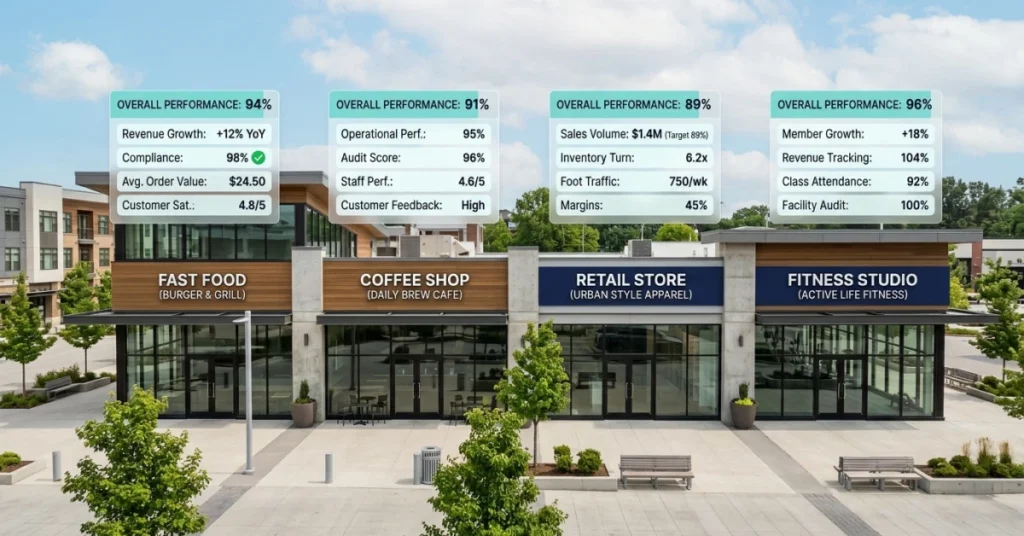
How Retailers Track Store Performance Metrics
Controlling those levers requires more than knowing they exist — it demands systems that surface the right data at the right moment. Retailers using real-time performance dashboards report up to 23% faster response to in-store execution gaps than those relying on weekly reports.
Most tracking failures aren’t tool problems — they’re architecture problems. Without a cause-and-effect structure, even the best dashboard becomes a retail store operations scoreboard instead of a control panel.
📊 By the Numbers
Retailers with structured KPI hierarchies are 2.5x more likely to act on performance data within 24 hours.
Mobile Store Audits and Field Reporting
Field teams using mobile audit tools close execution gaps 40% faster than teams relying on paper-based or email reporting. Real-time field data connects operational inputs directly to store-level KPIs — no lag, no guesswork.
Mobile audits capture conversion blockers — empty shelves, misplaced signage, compliance failures — before they erode revenue per square foot. That’s the difference between reactive damage control and proactive operational oversight.
Retail Dashboards and KPI Analytics
A dashboard only earns its place when it separates leading indicators from lagging ones — inputs from outputs. Tableau identifies conversion rate, units per transaction, and basket size as the operational levers merchants must monitor daily — not monthly.
Brands that measure these indicators in real time reduce revenue blind spots by acting on cause, not consequence. The right analytics setup tells you why revenue per square foot dropped — not just that it did.
AI-Powered Shelf and Customer Behavior Tracking
AI-driven shelf monitoring detects out-of-stock conditions in under 60 seconds — a gap that costs U.S. merchants an estimated $82 billion annually in lost sales. These tools translate shopper behavior directly into actionable business intelligence without manual observation.
Computer vision and foot traffic analytics reveal which store zones convert and which bleed dwell time without purchase. That granularity turns execution oversight from a reporting function into a merchandising weapon.
Real-Time Alerts and Performance Monitoring
Threshold-based alerts — triggered when conversion rate drops below a set benchmark — force operators to act on inputs before outputs suffer. According to Moz, brands that implement automated alerts see a 31% improvement in store-level KPI consistency across locations.
Real-time monitoring closes the loop between data and decision — the exact gap that keeps most operators permanently reactive.
The question isn’t whether your tools can surface the numbers; it’s whether your team is structured to act on what they reveal.
Conclusion
Structure is what separates a control panel from a scoreboard — and retailers who track operational inputs like conversion rate and units per transaction consistently outperform those fixated on revenue totals alone. Metrics only create value when organized into a cause-and-effect hierarchy that connects daily execution to financial outcomes.
Retailers lose visibility not from a lack of data, but from measuring lagging indicators while ignoring the leading ones — a gap that Trurating notes costs stores up to 20% in recoverable revenue annually. Aligning your retail brand execution with the right KPI hierarchy closes that gap fast.
Most retail dashboards flag problems after the quarter ends — Erply confirms that retailers tracking at least 5 operational KPIs in real time make faster, more profitable decisions. FieldPie captures field execution data — from photo audits to customizable forms — in real time, so your team shifts from scorekeeper to active operator and drives measurable performance at every location.


