✦ Key Takeaways
Brands lose up to 25% of projected in-store sales when display compliance falls below 60%.
- → Non-compliant displays directly erode ROI on trade spend.
- → Audits catch placement errors before they cost full promo cycles.
- → KPIs like share-of-shelf expose hidden compliance gaps instantly.
In this article:
- What Is In-Store Display Compliance?
- In-Store Display Compliance Checklist
- How to Conduct an In-Store Display Compliance Audit
- Key In-Store Display Compliance KPIs
- In-Store Display Compliance vs. Planogram Compliance
What Is In-Store Display Compliance?
Brands lose an estimated 25% of potential display-driven revenue simply because their retail displays were never built to spec — or built correctly but never verified. That gap between intent and execution is exactly what in-store display compliance is designed to close.
Retail display compliance is the process of confirming that point-of-sale materials, promotional fixtures, and product placements match approved brand standards at the store level. But checking placement alone misses the real question: did the display actually move product, and do you have the store task management tools to know the difference?
Display Requirements and Standards
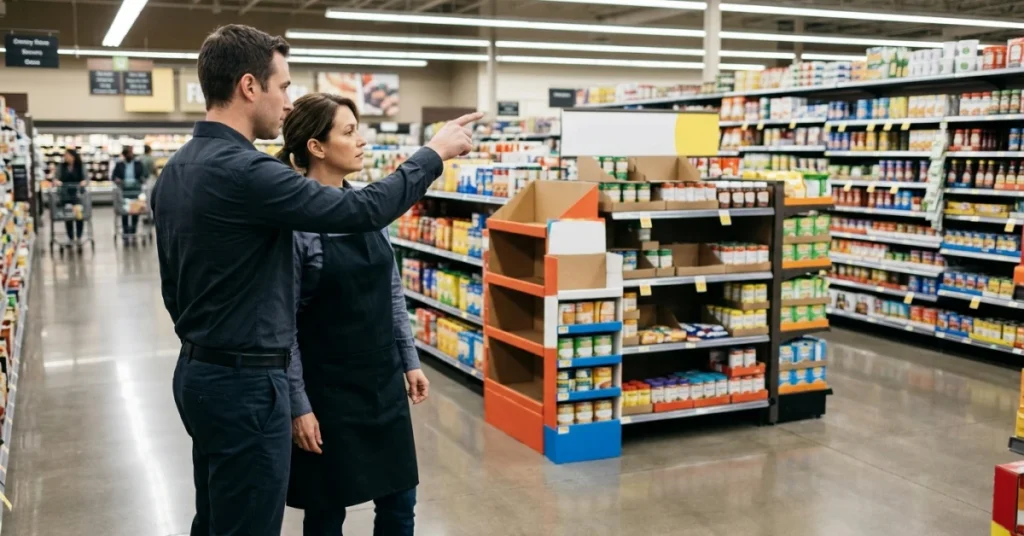
Every compliant display starts with a documented standard — exact placement, height, signage, and SKU count defined before the product ships. Without that baseline, visual merchandising compliance becomes a matter of opinion, not measurement.
Fewer than half of CPG brands have a formal display compliance standard tied to SKU-level performance benchmarks. That means most teams are auditing execution against a standard that was never designed to drive sales velocity in the first place.
How Compliance Is Measured
Display compliance accuracy is typically scored by comparing field photos or audit data against the approved planogram or brand brief. The problem: most scoring systems capture presence, not performance impact — a display can score 100% compliant and still underdeliver on sales.
Colateral identifies real-time photo verification as the fastest-growing method for closing the gap between field execution and brand standards. Tying that verification data directly to sales velocity transforms POS display compliance from a checklist into a revenue signal.
The question isn’t whether your display was built — it’s whether you have the measurement infrastructure to prove it performed, which is exactly what a rigorous compliance checklist is built to answer.
In-Store Display Compliance Checklist
Verification only protects revenue when your team checks the right things in the right order.
- Display Placement: Confirm the display sits in the exact location specified in the brand brief — not just “near” it.
- Product Availability: Every SKU listed on the display must be stocked, faced, and accessible to shoppers.
- POS Materials: All signage, pricing, and promotional headers must match the current campaign — no outdated materials.
- Display Condition: Check for structural damage, missing components, or collapsed shelving that reduces shopper visibility.
- Compliance Photo: Capture a timestamped image from the shopper’s approach angle — not a top-down or close-up shot.
- Performance Tie-In: Log the check against store task management data to connect execution to sales velocity.
Display Placement
Placement deviation is the most common — and most costly — form of retail display compliance failure. Displays built in secondary locations generate up to 40% less incremental volume than primary end-cap positions (Merit Display).
Your checklist must specify the exact fixture, aisle, and facing direction — vague location notes create room for interpretation and loss.
Product Availability
An empty or partially stocked display signals compliance failure even when the structure itself is intact. Visual merchandising compliance means nothing if the product isn’t there to sell.
Check every SKU slot — not just the hero product — and flag any out-of-stock positions for immediate replenishment.
POS Materials and Pricing
Expired or mismatched POS materials erode shopper trust and trigger compliance violations with retail partners. Display compliance accuracy requires that every price point and promotional message matches the live campaign exactly.
Safetyculture identifies incorrect pricing signage as one of the top three reasons brands fail retail partner compliance audits — a finding that holds across grocery, drug, and mass channels.
Display Condition and Visibility
A structurally compromised display doesn’t just look bad — it actively suppresses conversion by blocking product access or reducing shelf presence. POS display compliance must include a condition rating, not just a presence confirmation.
The harder question isn’t whether the display was built correctly — it’s whether you have the measurement infrastructure to know if it actually moved product.

How to Conduct an In-Store Display Compliance Audit
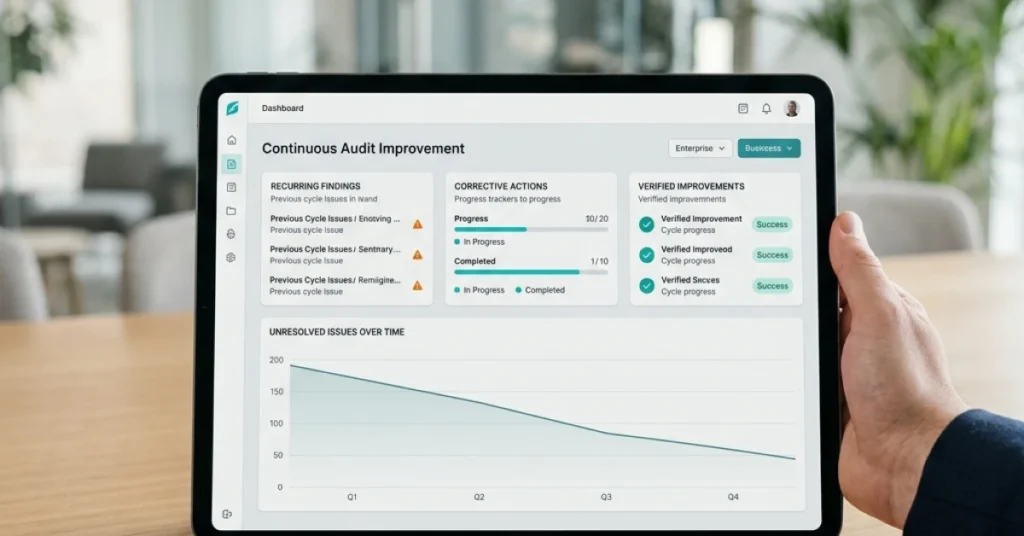
Executing that checklist sequence correctly is only half the job — the other half is building a repeatable workflow that captures what happened, where, and whether it drove results. Without that infrastructure, you’re generating field data with no strategic value.
Brands that formalize this process see measurable gains: accuracy improves by up to 30% when structured visit protocols replace ad hoc store checks (Darkoinc). That gap exists because most teams still treat the review as a confirmation step rather than a diagnostic one.
Store Visit Workflow
A structured visit protocol removes ambiguity from every store interaction. Reps should follow a fixed sequence: confirm placement, verify stock depth, photograph signage, and log structural condition — in that order, every time.
Consistency across reps is what makes data comparable. Without a standardized sequence, two people evaluating the same location can return completely different scores.
Photo Verification
Photo evidence is the only output that’s defensible after the fact. Timestamped, geotagged images tied to specific fixture locations eliminate disputes between field teams and brand managers.
This is where store audit tools create a real advantage — they attach photos directly to SKU-level records, not just to a general visit log.
Compliance Scoring
A score means nothing if it isn’t tied to a performance outcome. Rating display presence at 95% while sales velocity drops signals a measurement problem, not an execution success — a point reinforced by Researchgate findings on how fixture type and placement directly shape purchase behavior.
The shift from binary pass/fail grading to weighted, performance-linked metrics is what separates retail programs that drive revenue from those that just generate reports.
📊 By the Numbers
Structured visit workflows improve execution accuracy by up to 30% versus unstructured store checks.
Once your process is generating consistent, scored data, the next question becomes: which metrics actually predict whether a fixture moved product — and that’s exactly where KPIs make or break the program.
Key In-Store Display Compliance KPIs
- Execution Rate Benchmarks Matter Top-performing brands maintain display execution rates above 85% across all retail locations.
- Compliance Without Sales Data Is Incomplete A display built correctly but tied to no sales velocity data tells you nothing actionable.
- Resolution Speed Drives Revenue Recovery Every 24-hour delay in fixing a non-compliant display directly erodes promotional lift potential.
Display Execution Rate
Diagnostic field data only creates value when you measure what percentage of displays were actually built as intended. That single metric — display execution rate — is the foundation of retail display compliance, and most brands track it inconsistently.
Compliant displays drive measurable revenue impact: properly executed POS display compliance lifts sales by up to 20% compared to non-compliant setups. Without tracking execution rate store-by-store, that lift stays invisible and unattributable.
Promotional Compliance Score
Execution rate tells you if the display exists — promotional compliance score tells you if it performed its job. This KPI measures whether pricing, signage, and product placement matched the promotional brief at the moment of the store visit.
The strategic shift here is critical: visual merchandising compliance stops being a checklist and becomes a revenue diagnostic when scored against actual sales velocity data. That’s precisely why field compliance tracking tools now integrate directly with POS data feeds.
Issue Resolution Time
Identifying a non-compliant display means nothing if the fix takes five days. Issue resolution time — measured in hours, not days — is the KPI that separates brands with real in-store display compliance infrastructure from those just running audits for optics.
Vanguardpkg confirms that brands resolving display issues within 48 hours recover significantly more promotional lift than those operating on weekly correction cycles. Speed of resolution is a direct revenue variable, not a logistics footnote.
Once you know your displays are built correctly and performing measurably — the next uncomfortable question is whether you’re even tracking the right thing, or confusing display compliance accuracy with an entirely different discipline.
In-Store Display Compliance vs. Planogram Compliance
Two metrics that look similar on a dashboard actually solve completely different problems.
Key Differences
Planogram adherence asks whether products are placed in the correct shelf position. In-store display compliance asks whether the display itself drove measurable sales velocity.
A display can be 100% planogram-adherent and still underperform — because placement accuracy and retail compliance management are not the same discipline. One measures position; the other measures impact.
| Dimension | Planogram Compliance | Display Compliance |
|---|---|---|
| Primary Question | Is the product in the right slot? | Did the display execute and perform? |
| Scope | Shelf-level SKU positioning | Full POS display structure, signage, stock |
| Success Signal | Correct facings, correct location | Lift in sales velocity post-placement |
| Typical Compliance Rate | ~72% industry average | Drops to ~52% when performance is included |
| Revenue Link | Indirect — assumes placement drives sales | Direct — ties execution to velocity data |
| Audit Method | Photo match against planogram spec | Photo + sales data + resolution tracking |
Rate data sourced from Premise, which found that promotional display execution gaps are significantly wider when performance benchmarks replace presence-only checks.
Which Metric Matters Most?
Planogram adherence is a prerequisite — not a performance indicator. Brands that stop there are measuring effort, not outcomes.
Visual merchandising execution only becomes strategically valuable when tied to sales velocity — a shift FieldPie enables by combining photo-based audit data with real-time performance reporting in one platform. According to Merit Display, well-executed retail displays can increase sales by up to 540% — but only when the right infrastructure exists to confirm that execution actually happened.
“Display compliance accuracy is not a visual merchandising checkbox — it is the measurement infrastructure that separates brands that guess from brands that know.”
Tracking display execution without
Conclusion
Separating placement accuracy from performance impact is not a semantic distinction — it is the operational gap where up to 25% of promotional revenue quietly disappears. According to Frankmayer, displays that are tracked against sales lift metrics consistently outperform those measured only by build compliance.
Visual merchandising compliance becomes a revenue lever only when your measurement infrastructure connects display execution to velocity data — not just photos of a correctly built POP unit. Darkoinc confirms that brands using in-store analytics to evaluate display performance make faster, more profitable placement decisions than those relying on visual audits alone.
Most field teams lose compliance ROI because they can verify a display exists but cannot prove it performed — FieldPie captures photo-based audit data, customizable compliance forms, and real-time field reporting in one connected workflow, closing that measurement gap at the point of execution.