


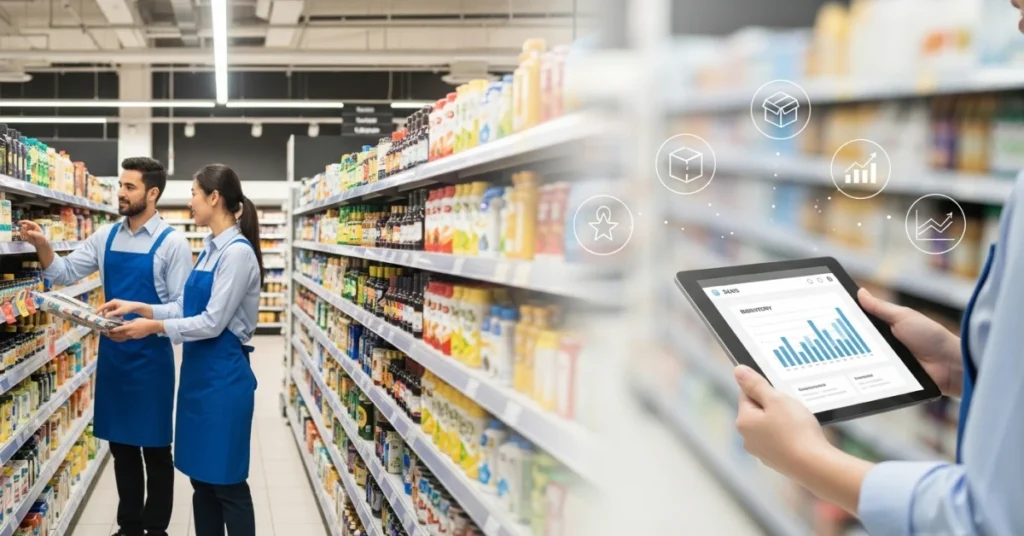
Retail success today depends on more than just sales. Modern retailers must monitor performance across store operations, inventory, merchandising, and customer experience. This is where KPIs for retail industry play a critical role.
Key Performance Indicators (KPIs) help retailers measure how well their stores, teams, and strategies are performing. By tracking the right retail KPIs, businesses can identify problems early, optimize operations, and improve profitability.
In this guide, we explore the top 15 KPIs for retail industry that every retailer should monitor to improve store performance and make data-driven decisions.
What Are KPIs for Retail Industry?
KPIs for retail industry are measurable metrics used to evaluate the performance of retail operations. These indicators help retailers understand how efficiently their stores are operating and how effectively they are serving customers.
Retail KPIs typically focus on areas such as:
- Sales performance
- Store operations
- Inventory management
- Customer experience
- Merchandising effectiveness
Tracking these KPIs allows retailers to transform raw data into insights that support better decision-making.
Top 15 KPIs for Retail Industry
Below are the most important retail metrics that businesses should track.
1. Sales Per Square Foot
Sales per square foot measures how efficiently a retailer uses its store space to generate revenue.
Formula:
Sales per Square Foot = Total Sales ÷ Store Size (Square Footage)
A higher value indicates that the store layout and merchandising strategy are effective.
2. Conversion Rate
The conversion rate measures the percentage of store visitors who actually make a purchase.
Formula:
Conversion Rate = (Number of Purchases ÷ Number of Store Visitors) × 100
This KPI helps retailers understand how well stores convert traffic into sales.
3. Average Transaction Value (ATV)
Average transaction value indicates how much customers spend per purchase.
Formula:
Average Transaction Value = Total Revenue ÷ Number of Transactions
Retailers often increase ATV through cross-selling, bundling, or promotions.
4. Inventory Turnover
Inventory turnover measures how often inventory is sold and replaced during a specific period.
Formula:
Inventory Turnover = Cost of Goods Sold ÷ Average Inventory
Higher turnover typically indicates strong demand and efficient inventory management.
5. Gross Margin Return on Investment (GMROI)
GMROI measures how much profit a retailer earns for every dollar invested in inventory.
Formula:
GMROI = Gross Margin ÷ Average Inventory Cost
This KPI helps retailers evaluate the profitability of their inventory.
6. Stockout Rate
The stockout rate measures how often products are unavailable when customers want to buy them.
Stockouts lead to lost sales and poor customer experience.
Monitoring this KPI helps retailers ensure shelves remain fully stocked.
7. Sell-Through Rate
The sell-through rate measures how much inventory is sold compared to the amount received.
Formula:
Sell-Through Rate = (Units Sold ÷ Units Received) × 100
This KPI helps retailers evaluate product demand and merchandising performance.
8. Sales Growth
Sales growth tracks how revenue changes over time.
Formula:
Sales Growth = ((Current Period Sales – Previous Period Sales) ÷ Previous Period Sales) × 100
Retailers use this KPI to evaluate overall business growth.
9. Customer Retention Rate
The customer retention rate measures how many customers return to make repeat purchases.
Higher retention usually leads to stronger long-term profitability.
10. Basket Size
Basket size measures the number of items purchased in a single transaction.
Retailers increase basket size through promotions, product bundles, and upselling.
11. Foot Traffic
Foot traffic measures the number of visitors entering a store.
When combined with conversion rate, it helps retailers understand store performance.
12. Employee Productivity
Employee productivity measures sales generated per employee.
Formula:
Sales per Employee = Total Sales ÷ Number of Employees
This KPI helps retailers evaluate workforce efficiency.
13. On-Shelf Availability
On-shelf availability measures whether products are physically present and available for customers.
Poor shelf availability leads to lost sales and reduced customer satisfaction.
14. Markdown Percentage
Markdown percentage measures how much product pricing has been reduced to clear inventory.
Formula:
Markdown % = (Markdown Amount ÷ Original Price) × 100
Retailers track this KPI to control margin loss.
15. Return Rate
The return rate measures how many products customers return after purchase.
Formula:
Return Rate = (Returned Items ÷ Total Sold Items) × 100
A high return rate may indicate product quality issues or inaccurate product descriptions.
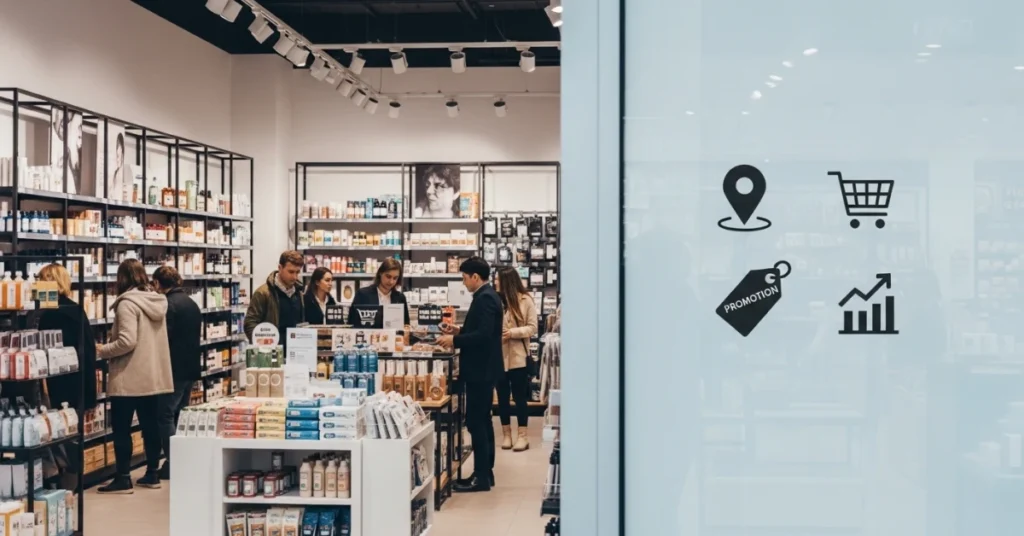
Why Tracking Retail KPIs Matters
Retailers that actively monitor KPIs for retail industry gain a clearer understanding of their operational performance.
Key benefits include:
- Better decision-making
- Improved inventory management
- Stronger store execution
- Higher sales performance
- Improved customer satisfaction
Without KPI tracking, retailers often rely on assumptions rather than data.
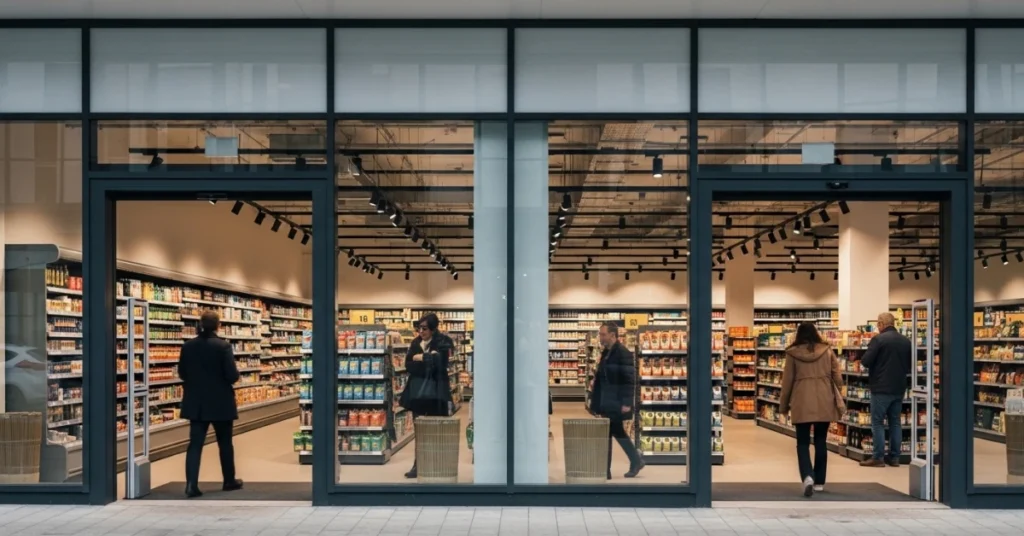
Conclusion
In today’s competitive retail landscape, success depends on measuring what truly matters. By tracking the right KPIs for retail industry, businesses can monitor store performance, optimize inventory, and improve the customer experience.
Retailers that use data-driven KPIs gain better visibility into their operations and can quickly identify opportunities for improvement.
Want better visibility into your retail operations?
Modern retail technology helps businesses track store performance, monitor merchandising execution, and improve operational efficiency using real-time data.
👉 Discover how FieldPie helps retailers track retail KPIs and optimize store performance.


