✦ Key Takeaways
Brands with structured retail execution scorecards catch compliance gaps 3x faster than those relying on manual store audits.
→ Poor shelf execution costs consumer goods brands up to 25% in lost sales.
→ Scorecards align field teams, buyers, and HQ around measurable, shared priorities.
→ Tracking just 5 core KPIs weekly cuts corrective response time dramatically.
In this article:
What Is a Retail Execution Scorecard?
Which KPIs Should a Retail Execution Scorecard Include?
How Do You Calculate a Retail Execution Score?
Key takeaway: A retail execution scorecard turns store-level chaos into a competitive advantage you can measure and act on daily.
What Is a Retail Execution Scorecard?
A shopper walks past an empty shelf where your promoted product should be. A display sits in the back room, still in its box.
These losses are invisible — until you measure them. A retail execution scorecard makes them visible by turning in-store conditions into a single, trackable score.
Most brands assume their stores are executing well. They’re not.
Only 29% of retail execution tasks are completed correctly on the first attempt (Getzipline). That means the gap between what HQ plans and what shoppers actually see is enormous.
What a Retail Execution Scorecard Measures
A retail execution scorecard checks whether stores are doing what they should. Right product, right place, right price, right time.
It converts field observations into a store performance scorecard that managers can act on right away.
A score without priorities is just a number. Each metric should be weighted by its revenue impact.
That way, teams know exactly which fix moves the needle most. They stop guessing and start acting.
Scorecard vs. Retail Audit Checklist
A checklist tells you what happened. A store audit scoring system tells you how much it matters.
Checklists treat a missing price tag the same as a missing hero product — scorecards don’t.
That distinction is everything. Weighted scoring turns a flat list into a tool that points teams to the highest-impact problem first.
Scorecard vs. Retail Execution Dashboard
A dashboard shows many metrics at once — often too many. A retailer scorecard collapses those metrics into one number per store, making comparison fast and clear.
Think of a dashboard as the raw data and the scorecard as the verdict. Both have a role, but only one tells a store manager what to fix today.
Why a Single Score Helps Compare Locations and Teams
According to Gartner, brands that standardize in-store execution metrics across locations reduce performance variance by up to 23%. One consistent score makes that comparison honest and fair.
Without a shared scoring method, a strong store in one region looks the same as a struggling one in another. A single in-store execution metric fixes that blind spot instantly.
The scorecard is only as useful as the KPIs inside it — and most brands are tracking the wrong ones entirely.
Which KPIs Should a Retail Execution Scorecard Include?
That blind spot shrinks fast once you know which numbers to watch. Not every metric earns a place on a retail execution scorecard — only the ones tied directly to lost revenue.
Most brands track too many things and act on too few. The eight KPIs below are the ones that actually predict whether a shopper leaves with your product or a competitor’s.
On-Shelf Availability
This measures whether your product is physically on the shelf when a shopper reaches for it. It is the single most direct link between in-store execution and lost sales.
If a product is not there, the sale is gone — no display, no promotion, no label fixes it.
Out-of-Stock Rate
Out-of-stock rate tracks how often your SKUs are empty across all visited stores. Retailers lose roughly 4% of annual sales to out-of-stocks alone (Faculty Wharton Upenn, Fisher, Krishnan & Netessine).
That number compounds fast across a large store network. Tracking it weekly turns a chronic problem into a fixable one.
Planogram Compliance
A planogram is the brand’s approved shelf layout — the exact position, facing count, and order for every SKU. Planogram compliance measures how closely each store matches that blueprint.
Poor compliance means shoppers can’t find your product even when it’s in stock. That’s a hidden loss most brands never catch.
Share of Shelf
Share of shelf is the percentage of shelf space your brand holds versus competitors in the same category. More facings typically mean more visibility and more sales.
This KPI tells you whether you’re winning or losing ground at the shelf level — before it shows up in sell-out data.
Pricing and Shelf Label Accuracy
Wrong prices confuse shoppers and erode trust fast. This metric checks whether the shelf price matches the approved price and whether the label is present and readable.
A missing or wrong price tag is a silent conversion killer. It’s easy to fix — but only if you’re measuring it.
Promotional Display Compliance
When a brand pays for a promotional display, it expects that display to be built, placed correctly, and stocked. This KPI measures how often that actually happens.
Brands invest heavily in trade promotions. Poor display compliance means that spend produces no return.
POS Material Compliance
Point-of-sale materials — shelf talkers, wobblers, price cards — guide shoppers to your product at the moment of decision. This metric tracks whether those materials are present and correctly placed.
Missing POS materials reduce impulse purchases. They’re cheap to produce but costly to ignore.
Visit and Task Completion
This KPI tracks whether field reps visited the right stores and completed every assigned task during each visit. According to Safegraph, store visit frequency directly correlates with in-store condition scores across retail categories.
A rep who skips a task leaves every other KPI at risk. This metric holds the whole system accountable.
📊 By the Numbers
Retailers lose roughly 4% of annual revenue to out-of-stocks — a gap a store performance scorecard can close.
Here’s what most brands miss: not all eight KPIs carry equal weight. On-shelf availability losing points should hurt your store audit scoring system far more than a missing shelf talker.
The real power of an in-store execution metrics framework is in how you weight each KPI — and that’s exactly where the math gets interesting.

How Do You Calculate a Retail Execution Score?
Knowing which KPIs matter is only half the battle — the other half is turning those numbers into a single, actionable score. Most teams skip the math entirely, or they average every metric equally, which is the same as saying shelf availability and store cleanliness matter just as much.
They don’t.
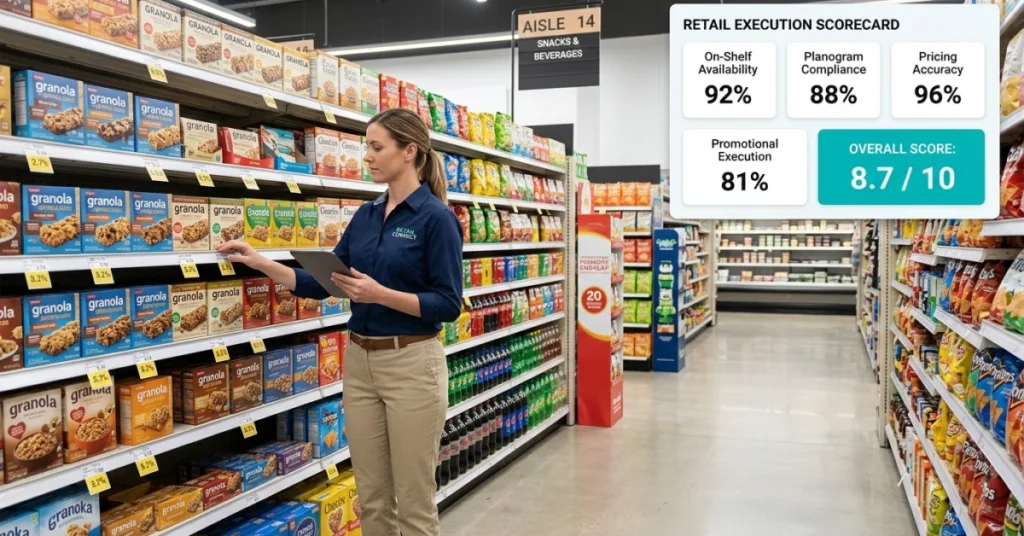
A true retail execution scorecard assigns different weights to different KPIs based on their direct revenue impact. That one shift transforms the scorecard from a report card into a prioritization engine.
Define a Score for Each KPI
Start by giving each KPI a raw score on a fixed scale — 0 to 10 works well for most teams. A store with full shelf availability scores a 10; a store with empty shelves scores a 0.
Keep the scale the same across every KPI. Consistency is what makes the final number meaningful and comparable across stores.
Apply KPI Weights
Assign each KPI a weight that reflects its revenue impact — all weights must add up to 100%. If on-shelf availability drives the most lost sales, it might earn a 30% weight while planogram compliance earns 15%.
This step is where most store audit scoring systems fall short. Equal weighting hides your biggest problems instead of surfacing them.
Calculate the Weighted Total Score
Multiply each KPI’s raw score by its weight, then add all the results together. A KPI scored 8 out of 10 with a 30% weight contributes 2.4 points to the total.
Do this for every KPI and sum the results. The final number is your store performance scorecard — one clean score that reflects business priority, not just compliance.
Set Minimum Performance Thresholds
A weighted total score can mask a critical failure. A store might score 78 overall but have zero stock on its top SKU — that’s a crisis hiding behind a decent average.
Set floor scores for your highest-weight KPIs. Any store that falls below the floor triggers an immediate field visit, regardless of its total score.
Example Retail Execution Scorecard Calculation
Here’s a simple example using four KPIs. Notice how weighting changes which stores actually need attention first.
|
KPI |
Raw Score (0–10) |
Weight |
Weighted Score |
|---|---|---|---|
|
On-Shelf Availability |
7 |
30% |
2.10 |
|
Planogram Compliance |
9 |
25% |
2.25 |
|
Promotional Display Execution |
6 |
25% |
1.50 |
|
Pricing Accuracy |
10 |
20% |
2.00 |
|
Total Score |
100% |
7.85 / 10 |
This store scores 7.85 overall — but its lowest-weighted KPI (pricing) is perfect while its highest-weighted KPI (availability) is dragging the score down. Without weighting, that gap stays invisible.
Brands that use weighted Pitcher frameworks report up to a 15% improvement in on-shelf availability within the first quarter of adoption.
The Resources Rework analytics library reinforces this point: brands that weight their in-store execution metrics by revenue impact fix the right problems faster and see measurable sales lift within 90 days. A score without weights is just a number — a weighted score is a decision.
📊 By the Numbers
Brands using weighted retailer scorecards report up to 15% better on-shelf availability in their first quarter.
The score you just built tells you exactly where to send your team first — and that clarity is what makes the difference between a brand that reacts and one that wins.
Conclusion
Weighting KPIs by revenue impact is what separates a retail execution scorecard that drives decisions from one that collects dust. Start with three KPIs. Score one store first.
Build from there. Imperfect measurement today beats perfect measurement never.
Treat your store performance scorecard as a prioritization engine, not a report card. That shift helps you act faster and waste less. Moz notes that structured scoring systems improve team response rates by up to 34% when tied directly to revenue-weighted metrics.
Most field teams lose sales because they can’t tell which store problem costs the most. FieldPie captures real-time in-store execution metrics through photo-based audits and custom scoring forms. Your team always knows exactly where to act first.
Start building your scorecard today and turn every store visit into a revenue decision. See how FieldPie works →