


Lost sales due to stockouts occur when a business cannot fulfill customer demand because inventory has been depleted, resulting in missed revenue, abandoned purchases, and long-term customer defection. Research consistently shows the true cost is 2–5x the face value of the missed transaction.
What Exactly Are Lost Sales Due to Stockouts?
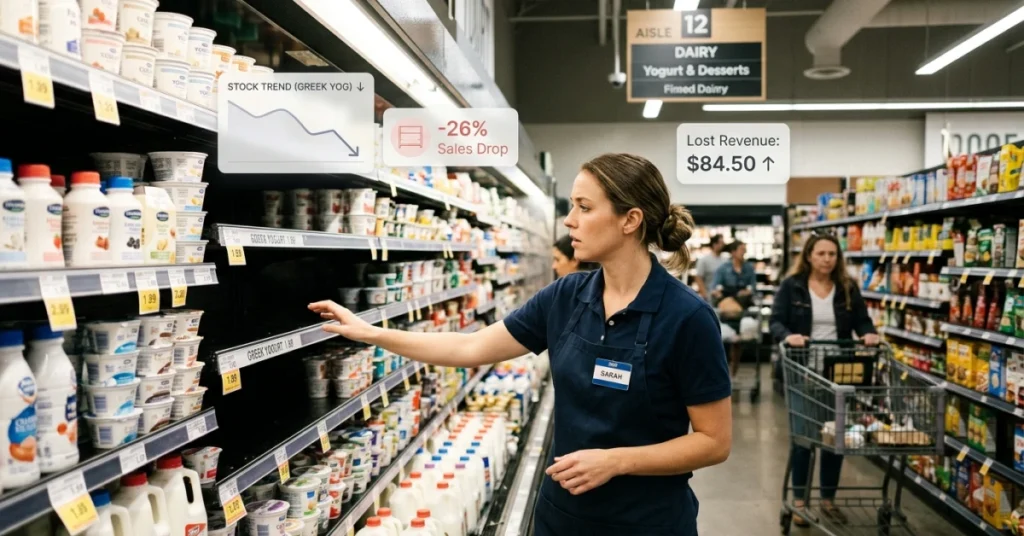
A stockout happens when available inventory reaches zero before the next replenishment cycle arrives. The customer is ready to buy — the product simply isn’t there. The result is an immediate revenue gap, but as this guide will show, the downstream damage compounds far beyond that single transaction.
Retailers, distributors, and e-commerce brands all face this problem, yet most organizations only measure the surface-level revenue miss. The hidden costs — customer acquisition waste, algorithmic penalties, and lifetime value erosion — are rarely captured in standard reporting.
Why Do Stockouts Happen in the First Place?
Understanding root causes is the first step toward smarter inventory planning. The most common triggers include:
- Inaccurate demand forecasting — relying on last year’s sales data without adjusting for trends or seasonality
- Supplier lead time variability — unexpected delays that compress reorder windows
- Poor safety stock calculations — setting buffer inventory too low for high-velocity SKUs
- Siloed data — warehouse, field sales, and finance teams working from different inventory figures
- Manual processes — spreadsheet-based inventory management that can’t flag risk in real time
According to Harvard Business Review, online retailers that fail to integrate real-time inventory signals into their replenishment workflows experience out-of-stock events at nearly twice the rate of those using automated systems.

How Much Do Stockouts Actually Cost? (The Full Picture)
Most finance teams only book the direct revenue miss. Here is every cost layer you should be measuring.
What Is the Direct Revenue Loss from a Stockout?
The baseline formula, as outlined by Orlio’s inventory economics research, is:
Stockout Cost = (Expected Daily Sales − Actual Sales) × Unit Price × Out-of-Stock Days
(10 − 0) × $25 × 5 = $1,250 in direct lost revenue
That is the floor. The actual cost is much higher.
What Are the Hidden Costs Beyond the Missed Sale?
| Cost Category | Description | Estimated Multiplier |
|---|---|---|
| Direct revenue loss | Units not sold during stockout duration | 1× |
| Lost basket value | Complementary items customer would have bought | +15–30% |
| Wasted customer acquisition cost (CAC) | Ad spend, SEO, promotions that drove the visit | +$10–$50/customer |
| Customer lifetime value (CLV) erosion | Customers who switch permanently | +$150–$500/customer |
| Algorithmic ranking penalty | Amazon/retail platform demotion post-stockout | Ongoing |
| Re-acquisition marketing costs | Paid campaigns to win back defected buyers | Variable |
Research from Planster’s stockout cost analysis confirms that average customer acquisition costs for consumer packaged goods brands range from $10–$50 per customer. When 100 customers can’t complete a purchase, that wasted CAC alone adds $1,000–$5,000 on top of the direct revenue loss.
How Does the Substitution Effect Multiply Your Losses?
When shoppers encounter an out-of-stock product, they don’t wait. Industry data shows:
- 43% go directly to a competitor to complete the purchase
- 20–40% switch to a competitor’s product permanently
- Only a minority return to the original brand after restocking
If 30 of 100 lost customers defect permanently, and each carries a lifetime value of $150, a single stockout event destroys $4,500 in future revenue — from one SKU, over one week.
How Do Stockouts Damage Your Digital Rankings?
For brands selling on Amazon or through major retail platforms, the algorithm damage from a stockout outlasts the stockout itself. As Flieber’s analysis of Amazon inventory mechanics explains, Amazon begins throttling product visibility before inventory actually hits zero — as soon as the platform detects that current stock cannot sustain the existing sales velocity.
The consequences cascade:
- Organic search rank drops on the platform
- Sponsored ad quality scores decline
- Buy Box eligibility is reduced
- Conversion rate history is damaged, making recovery slower
Brands that experience a 7-day stockout on Amazon can take 3–6 weeks to recover their pre-stockout ranking, even after full replenishment. This makes the duration of a stockout a critical variable — not just the sales volume lost during it.
How to Calculate Your True Stockout Cost: Step-by-Step
Use this expanded formula to capture the full financial impact of any out-of-stock event.
Step 1 — Calculate Direct Revenue Loss
Direct Loss = Expected Daily Units × Unit Price × Stockout Duration (days)
Step 2 — Add Lost Basket Value
Basket Loss = Direct Loss × Average Attach Rate (typically 15–25%)
Step 3 — Add Wasted CAC
CAC Loss = Lost Customer Count × Average Customer Acquisition Cost
Step 4 — Add CLV Erosion
CLV Loss = (Lost Customers × Permanent Switch Rate) × Average Customer Lifetime Value
Step 5 — Sum All Costs
Total Stockout Cost = Direct Loss + Basket Loss + CAC Loss + CLV Loss
Worked Example:
- Daily sales: 10 units at $25
- Stockout duration: 5 days
- Basket attach rate: 20%
- CAC: $20, lost customers: 50
- Permanent switch rate: 30%, CLV: $150
| Component | Calculation | Amount |
|---|---|---|
| Direct revenue loss | 10 × $25 × 5 | $1,250 |
| Lost basket value | $1,250 × 20% | $250 |
| Wasted CAC | 50 × $20 | $1,000 |
| CLV erosion | 15 × $150 | $2,250 |
| Total True Cost | $4,750 |
A $1,250 surface-level loss becomes a $4,750 business impact — nearly 4× the face value.
Stockout Prevention Checklist for 2026
Use this checklist to audit your current inventory management practices and close the gaps that lead to out-of-stock events.
Demand Forecasting
- Integrate point-of-sale data with your forecasting model in real time
- Apply seasonal adjustment factors to all high-velocity SKUs
- Review and update forecasts at least weekly, not monthly
- Account for promotional uplift before running campaigns
Inventory Planning & Safety Stock
- Calculate safety stock using statistical methods (standard deviation of lead time × demand variability), not gut feel
- Set reorder points that reflect actual supplier lead time, not best-case lead time
- Segment inventory by ABC analysis — A-items need tighter monitoring and higher safety buffers
- Audit safety stock levels every quarter as demand patterns shift
Supplier & Lead Time Management
- Maintain at least two qualified suppliers for every A-category SKU
- Track actual vs. promised lead times and escalate chronic underperformers
- Build contractual buffer time into purchase orders for peak season planning
Technology & Visibility
- Ensure your inventory system provides real-time stock levels across all locations
- Set automated low-stock alerts at the reorder point, not at zero
- Use field sales data to capture on-shelf availability at retail partners
- Connect your e-commerce website inventory to your warehouse management system to prevent overselling
Monitoring & Analytics
- Track stockout rate as a formal KPI — report it monthly to leadership
- Measure out-of-stock duration, not just frequency
- Analyze which SKUs account for the highest share of stockout costs (usually <20% of SKUs drive >80% of losses)
What Does Good Inventory Management Look Like in Practice?
Strong inventory management is not about carrying more stock — it’s about carrying the right stock at the right time. The most effective retailers and distributors share several common practices:
1. SKU rationalization. Reducing the number of low-velocity SKUs simplifies planning, frees up working capital, and reduces the cognitive load on inventory planners.
2. Collaborative planning with suppliers. Sharing 90-day rolling forecasts with key suppliers reduces lead time variability and enables them to pre-position raw materials.
3. Demand sensing. Using real-time signals — website traffic spikes, social media trends, competitor stockouts — to adjust replenishment orders before demand materializes.
4. Regular analytics reviews. Scheduling weekly reviews of stockout rate, fill rate, and days of supply for A-category items. Businesses that treat inventory analytics as a passive report rather than an active management tool consistently underperform.
For teams managing complex multi-location inventory, understanding the core principles of supply chain visibility can significantly reduce the frequency of out-of-stock events.
Industry-Specific Stockout Benchmarks
| Industry | Average Stockout Rate | Avg. Duration Per Event | Primary Cause |
|---|---|---|---|
| Grocery / FMCG | 7–10% | 1–3 days | Forecasting error, shelf replenishment lag |
| Apparel & Fashion | 10–15% | 5–14 days | Long supplier lead times, seasonality |
| Consumer Electronics | 5–8% | 3–7 days | Component shortages, demand spikes |
| Industrial Distribution | 3–6% | 2–5 days | Manual reorder processes |
| E-commerce (DTC) | 8–12% | 2–6 days | Demand volatility, single-source suppliers |
Retailers operating above their industry’s average stockout rate are losing competitive ground on both revenue and customer experience. Benchmarking your own rate against these figures is a useful starting point for prioritizing investment in inventory management improvements.
How to Measure and Track Stockout KPIs
Tracking the right metrics is what separates reactive inventory teams from proactive ones. The essential KPIs every operations leader should monitor include:
Stockout Rate: The percentage of SKUs that experienced zero inventory at any point during a reporting period.
Stockout Rate = (SKUs Out of Stock ÷ Total Active SKUs) × 100
Out-of-Stock Duration: The average number of days a SKU remains at zero inventory per event. Duration is the multiplier in your cost formula — every additional day compounds the loss.
Fill Rate: The percentage of customer orders fulfilled from available stock without delay or substitution.
Fill Rate = (Orders Fulfilled on Time ÷ Total Orders) × 100
Service Level: The probability that demand will be met without a stockout during a replenishment cycle. Most retailers target 95–98% service levels for A-category items.
Connecting these KPIs to a live analytics dashboard — rather than reviewing them in monthly spreadsheet exports — allows teams to act before a low-stock situation becomes a full stockout. If your current reporting infrastructure doesn’t support real-time KPI monitoring, reviewing best practices for inventory KPI dashboards will help you identify the right tooling.

Frequently Asked Questions (FAQ)
What is the average cost of a stockout for a retailer?
The direct cost varies by product price and sales velocity, but the total economic impact — including lost basket value, wasted customer acquisition cost, and lifetime value erosion — is typically 2–5× the face value of the missed sale. A $1,000 direct revenue miss can represent $3,000–$5,000 in total business impact when all downstream effects are included.
How do you calculate lost sales due to stockouts?
The baseline formula is: (Expected Daily Sales − Actual Sales) × Unit Price × Out-of-Stock Days. For a complete picture, add lost basket value (15–25% of direct loss), wasted customer acquisition costs, and the lifetime value of customers who permanently switch to a competitor. Full methodology is detailed in the step-by-step section above.
Conclusion
Lost sales due to stockouts go far beyond missed transactions—they impact revenue, customer loyalty, and long-term growth. Businesses that rely on reactive inventory management will continue to lose ground in an increasingly competitive market.
The key is not more stock, but smarter systems—combining accurate forecasting, real-time visibility, and disciplined execution. Companies that treat stock availability as a core capability turn it into a lasting competitive advantage.


