✦ Key Takeaways
Companies with optimized sales territory coverage report up to 20% higher revenue per rep.
→ Uneven territories waste rep capacity and kill quota attainment.
→ Coverage gaps directly signal where pipeline is leaking money.
→ Reassigning just 10% of accounts can rebalance an entire region.
In this article:
What Is Sales Territory Coverage?
How to Measure Sales Territory Coverage
What Sales Territory Coverage Reveals
Key takeaway: Measure territory coverage now or surrender revenue to better-organized competitors.
What Is Sales Territory Coverage?
Most sales organizations treat territory coverage as a headcount problem — assign a rep, draw a boundary, call it covered. That assumption quietly kills pipeline.
Coverage isn’t about who owns a territory on paper. It’s a data visibility into accounts problem — and most teams have almost none of it.
What It Means
Sales territory coverage measures how much of an assigned territory is actively worked — not just claimed. It tracks rep activity, account penetration, and engagement frequency at the account level.
Without that granularity, sales territory management is just map-drawing. You cannot optimize what you have never actually measured.
Why It Matters for Field Sales
Field reps naturally gravitate toward familiar accounts — studies show reps spend up to 65% of their time on accounts that already know them. That leaves the majority of assigned territory functionally invisible.
Poor Manus coverage data means leadership can’t distinguish a hard market from a neglected one. Every bad quarter gets misread as a demand problem when it’s actually a coverage problem.
Coverage vs. Territory Management
Sales territory planning sets the boundaries; coverage measurement reveals whether those boundaries translate into real activity. As Abacum notes, companies that align territory design with account-level activity data see measurably stronger pipeline conversion rates.
Sales territory optimization starts the moment you stop assuming assignment equals coverage — and start measuring the gap between the two. The only way to close that gap is to know exactly how coverage is being measured in the first place.
How to Measure Sales Territory Coverage
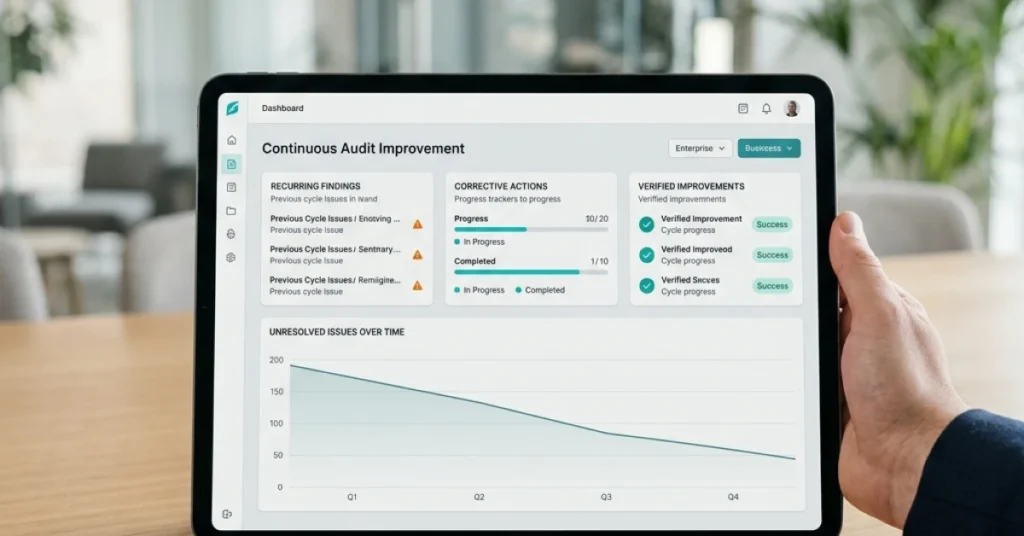
Measurement starts at the account level — not the zip code level. Without activity data tied to specific accounts, sales territory coverage numbers are fiction dressed up as strategy.
The gap between assigned and worked accounts exposes the real problem. Researchgate found that organizations using account-level analytics improve rep productivity by up to 30% compared to those relying on geographic headcount models alone.
Effective sales territory planning frameworks require three data inputs: total addressable accounts, accounts touched, and activity frequency per account. Varicent reinforces that without this granularity, even well-designed regions produce blind spots that silently drain pipeline.
Sales Territory Coverage Formula
The core formula is straightforward: Coverage % = (Accounts Touched ÷ Total Assigned Accounts) × 100. A rep claiming a territory isn’t the same as a rep actively working it.
Most teams discover their actual engagement rate sits 20–35 points below what CRM pipeline data implies. That gap is where revenue disappears.
Key Coverage Metrics
Account Touch Rate — % of assigned accounts with at least one logged activity
Activity Density — Average interactions per account per quarter
Coverage Velocity — Rate at which new accounts enter active engagement
Whitespace Ratio — % of ICP-fit accounts with zero rep contact
Revenue per Covered Account — Isolates productivity from volume
These metrics shift sales territory management from a scheduling exercise into a diagnostic tool. Each number points to a specific failure mode, not a general trend.
Under-Covered vs. Over-Covered Areas
Over-concentration wastes rep capacity on low-potential accounts while high-value targets go untouched. Both conditions are invisible without account-level sales territory optimization data.
Imbalanced distribution isn’t just an efficiency problem — it’s a signal about rep behavior, coaching gaps, and flawed design that no headcount adjustment will fix.

What Sales Territory Coverage Reveals
Account-level gaps don’t stay hidden — they show up in pipeline shortfalls, missed quotas, and accounts that haven’t been touched in quarters. Sales territory coverage exposes exactly where activity stops matching ambition.
Most organizations discover these failures after the damage is done. According to Xactlycorp, companies that implement structured sales territory planning frameworks see up to 20% improvement in sales productivity — a gain that’s impossible without first measuring what’s actually being worked.
Customer Visit Frequency
Low visit frequency is the clearest signal that a region is claimed on paper but neglected in practice. Accounts receiving fewer than two touches per quarter rarely convert — and rarely appear on anyone’s radar until renewal risk spikes.
Sales Rep Workload Balance
Uneven workload distribution forces high-potential accounts into neglect by default — not by strategy. Everstage notes that lopsided assignments directly suppress rep performance and inflate voluntary attrition rates.
Geographic Coverage Gaps
Geography reveals concentration, not reach. A rep logging 80% of activity in one metro cluster while ignoring adjacent accounts isn’t managing a full book of business — they’re cherry-picking it.
Missed High-Value Opportunities
High-value accounts sitting untouched represent the most expensive blind spot in sales territory optimization. Engagement data makes these gaps visible — before a competitor fills them instead.
Conclusion
Closing coverage gaps after quota misses is reactive — the damage is already done. Sales territory coverage is a data visibility problem first, and a headcount or geography problem second.
Teams that measure actual activity at the account level — not just assigned territory on paper — consistently outperform those that don’t. According to Moz, organizations that build structured measurement into their sales territory planning process see up to 30% improvement in rep productivity within two quarters.
Unworked accounts don’t show up in dashboards built around assignment — they show up in lost revenue. Manus reinforces this in their territory mapping playbook: sales territory optimization starts with knowing exactly which accounts were touched, when, and by whom — not with redrawing boundaries.