✦ Key Takeaways
Up to 30% of retail merchandising tasks get redone, silently draining labor budgets and shelf performance.
→ Rework inflates labor costs without adding any revenue.
→ Poor planogram compliance is the top driver of repeat fixes.
→ Tracking rework rate exposes hidden inefficiencies teams can eliminate fast.
In this article:
What Is Merchandising Rework Rate?
How Do You Calculate Merchandising Rework Rate?
What Causes High Merchandising Rework Rates?
Key takeaway: Merchandising rework rate is the clearest signal your retail execution is broken.
What Is Merchandising Rework Rate?
Most retail teams treat rework as a field problem — a rep who missed a step, a store that didn’t comply. But merchandising rework rate is really a planning signal, exposing gaps in how directives get built and sent, not how store teams perform.
Retail execution failures cost brands billions each year. Out-of-compliance displays alone erode up to 25% of expected in-store sales lift, according to Statista. The fix almost never lives in retraining field reps.
What Counts as Rework in a Merchandising Operation?
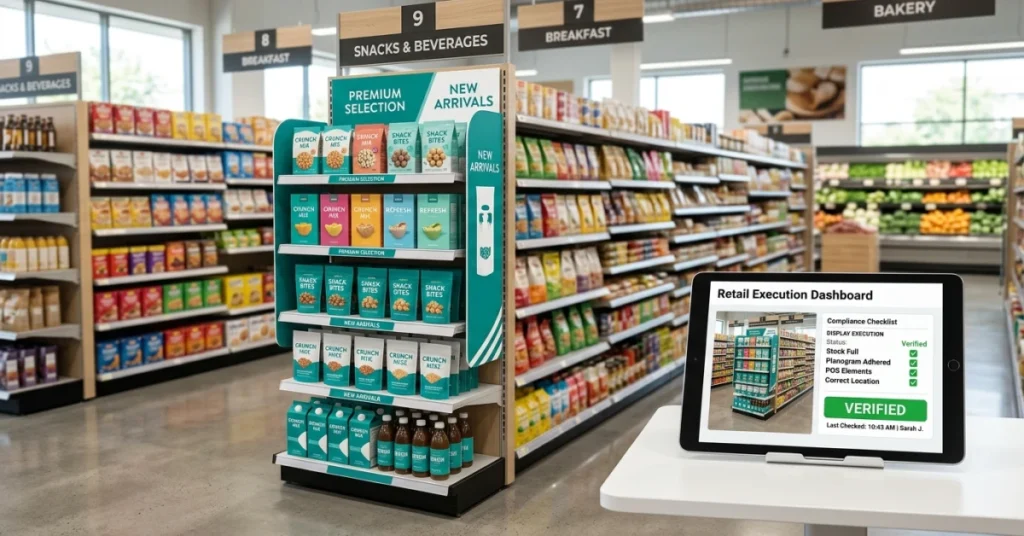
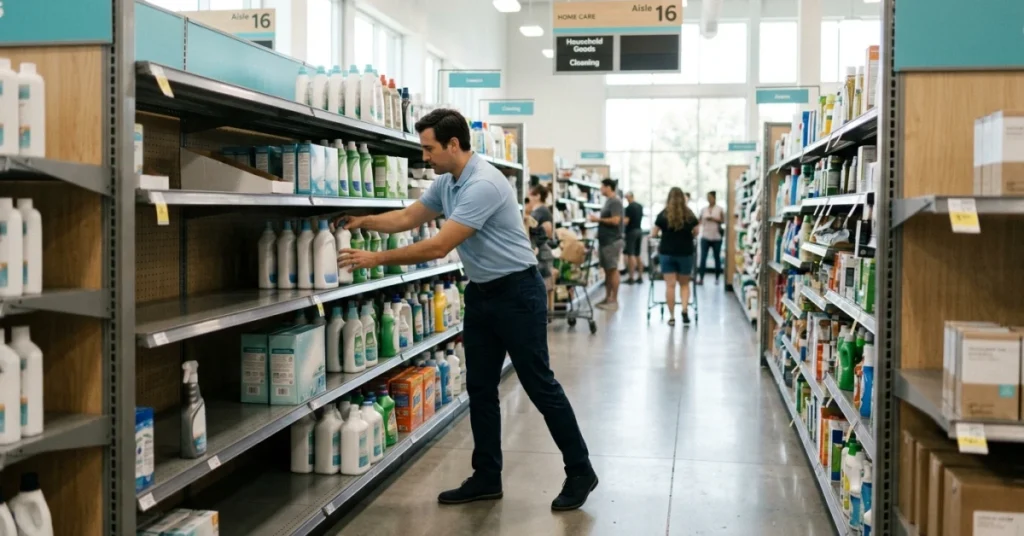
Rework is any task a field rep must redo because the first execution didn’t meet the standard. That includes resetting a display, correcting a planogram, or re-tagging a shelf after a failed audit.
Not every correction is rework — only tasks that were completed once and still failed. If a rep skipped a step, that’s a miss; if they followed the directive and still failed, that’s a planning gap.
How Is Rework Different From a Routine Follow-Up Visit?
A follow-up visit is scheduled and expected — it’s part of the cycle. Rework is unplanned and signals something broke upstream in the process.
Rework burns labor budget without adding value, which is why merchandising ROI metrics must track it separately from standard visit frequency.
Why Rework Rate Matters for Merchandising Agencies and Retail Teams
A high rework rate raises cost-per-store and cuts margin. HubSpot data shows operational inefficiency is a top driver of marketing budget waste across field-heavy teams.
Agencies that ignore this metric lose contracts. Retail teams that ignore it lose shelf performance.
Rework rate is one of the sharpest visual merchandising KPIs you can track. It tells you whether your directive process is sound — before a bad quarter tells you first.
To fix the rate, you first need to measure it. The formula is more specific than most teams expect.
How Do You Calculate Merchandising Rework Rate?
Once you know rework signals broken planning, you need a number that proves it — and holds the right people accountable.
The merchandising rework rate is a core visual merchandising KPI that most teams already have the data to calculate. They just haven’t framed it as a planning metric yet.
Merchandising Rework Rate Formula
The base formula is simple: divide rework visits by total visits, then multiply by 100. A rate above 15% is a red flag that directives — not field teams — are the problem.
Track this number by directive, not by rep. If one planogram triggers rework across 40 stores, the directive is broken — full stop.
Should Rework Be Measured by Visit, Store, Task, or Labor Hour?
Measure by task first — it gives you the sharpest signal. A single store visit can hide three rework tasks if you only count at the visit level.
Labor hours add dollar weight to the problem, which is why merchandising ROI benchmarks use hours as the final accountability layer.
Which Rework Costs Should Be Included in the Calculation?
Include travel time, labor hours, and any materials replaced — not just the time spent fixing the display. Retailers who track full rework cost find it runs 20–30% higher than labor alone (Contravision, visual merchandising research).
Skip the partial count and you’ll understate the problem — which makes it easier to ignore the real fix upstream. Baymard‘s cart abandonment data shows a parallel truth: small friction points compound fast when the root cause goes unfixed.
📊 By the Numbers
Full rework cost runs 20–30% higher than labor alone when travel and materials are counted.
Now the real question is: what keeps pushing that rate above 15% in the first place?

What Causes High Merchandising Rework Rates?
You flagged a planogram by rework rate. Now ask the real question: what broke the directive?
Most teams blame store reps. The data points elsewhere.
Over 70% of execution failures trace back to unclear task instructions or missing materials. This happens before the rep ever walks in the store (Bureau of Labor Statistics). That’s a planning problem. Not a training problem.
Tracking your merchandising KPIs by directive shows which upstream decisions drive rework. It puts accountability where it actually belongs.
📊 By the Numbers
U.S. retail sales top $7 trillion a year. Poor execution cuts into margin at every shelf (Census).
Incomplete or Incorrect Shelf Execution
Wrong facings, skipped SKUs, and bad shelf placement are the most visible rework triggers. They look like rep errors. But they almost always follow a vague or outdated planogram directive.
Missing POSM and Promotional Materials
A rep can’t place a display that never arrived. Missing point-of-sale materials force partial execution. Partial execution always triggers a rework visit.
Planogram and Display Compliance Errors
Planograms built on stale store data create impossible tasks at the shelf. Reps improvise. Improvisation is the top driver of a high merchandising rework rate.
Poor Visit Instructions or Unclear Task Requirements
Vague task briefs produce inconsistent results across every store. When reps read instructions differently, rework becomes inevitable. Not occasional.
Missing Photo Evidence and Incomplete Forms
No photo means no proof. No proof means a second visit to verify. This inflates your rework rate even when the shelf work was done correctly.
Product Availability and Inventory Issues
Out-of-stocks block execution before it starts. Reps close the task incomplete. The visit gets logged as a rework trigger, not a supply chain failure.
Store Access and Client-Side Restrictions
Locked stockrooms, unavailable managers, and restricted floor access kill visits fast. These barriers are predictable. A strong directive accounts for them before the rep arrives.
Every cause on this list points to the same source: a directive not built for real store conditions. The fix is a planning conversation. Not a performance review.
Conclusion
Blaming store reps fixes nothing when the directive itself is broken.
Merchandising rework rate is a planning signal. The data you track by directive shows exactly where upstream decisions went wrong.
Over 30% of retail execution failures trace back to incomplete or unclear planogram instructions. It is not about undertrained field staff, according to Statista.
Fixing your visual merchandising KPIs starts with fixing how directives are built. Pushing reps harder will not fix a broken planning process.
Most teams chase rework after it happens. That is too late.
FieldPie captures photo-based field data at the directive level. Real-time reports surface planning gaps before the next rollout ships.
Your rework rate data then drives decisions that stick. It stops being a metric and starts being a fix.