✦ Key Takeaways
Up to 80% of merchandising agency revenue can come from clients who actually destroy profit margins.
→ High-volume clients often hide the worst profitability numbers.
→ Accurate cost allocation exposes which accounts drain agency resources.
→ Renegotiating scope and pricing can flip losing clients profitable fast.
In this article:
What Is Merchandising Client Profitability?
How Do You Calculate Merchandising Client Profitability?
Which Merchandising Clients Are Actually Profitable?
How Can Merchandising Agencies Improve Client Profitability?
Key takeaway: Track true client profitability or your fastest-growing accounts will bankrupt you.
What Is Merchandising Client Profitability?
Most merchandising agencies think a busy client roster means a profitable one — that assumption quietly kills margins. Revenue tells you how much a client pays. It tells you nothing about how much they cost to serve.
Over 40% of service businesses cannot identify which clients generate profit versus which ones drain it (according to Statista). That blind spot hits hard in merchandising.
Field labor, route time, and untracked scope creep never show up on a standard P&L. Those costs are real — and they belong to specific clients.
Merchandising client profitability is the net value one client delivers after every real cost is counted. That includes field-execution costs most agencies never track.
The number that matters is not what a client pays. It is what they leave behind after your team walks out of the store.
Which Costs Should Be Included in Client Profitability?
Standard gross-margin math captures direct labor and materials. But merchandising work carries a second layer of costs. Most agencies ignore it entirely. Route inefficiencies, unplanned store revisits, and field rep idle time are real expenses. They belong to specific clients — not to overhead.
A complete client profitability measurement model must include field travel time and supervisor oversight hours. Add compliance rework and technology costs tied to that account. Skip even one of these categories and a losing client can look like a winner on paper.
Why Revenue Alone Does Not Show Whether a Client Is Profitable
A high-revenue client can cost more to serve than they pay. Complex store needs, frequent scope changes, and wide geographic spread all drive up costs fast.
Research from Journals E Palli confirms this gap shows up consistently in service-heavy industries. Revenue is an input. Profit is the outcome.
This is why client reporting frameworks must go beyond billing summaries and capture actual field-cost attribution per account. Separate cost from revenue at the client level. Do that, and the real picture — and the real problem — snaps into focus.
Knowing what merchandising client profitability means is the easy part. The harder question is: do you actually have the numbers to calculate it?
How Do You Calculate Merchandising Client Profitability?
Fixing that blind spot starts with one discipline: assigning every dollar of cost to the client that caused it. Most agencies run a single P&L, which hides which clients drain margin and which ones build it.
Field labor is the biggest culprit. Reps do tasks that never appear on an invoice — fixing displays, re-doing missed stores, driving longer routes.
That hidden time quietly kills merchandising client profitability one hour at a time. The damage adds up fast.
Agencies that track cost at the client level — not just the company level — find that 20% to 30% of their client roster drives the majority of field-execution overhead (Mybrandforce). That number rarely shows up in a standard gross-margin report.
Client Profitability Formula for Merchandising Agencies
The core formula is simple: Client Profit = Client Revenue − Direct Labor − Travel − Overhead Allocation − Rework Costs. Each variable must be tracked per client — not pooled across the agency.
Client profitability measurement only works when you separate billable hours from total hours logged per account. The gap between those two numbers is your hidden loss.
How to Calculate Cost per Visit, Store, and Labor Hour
Start with total rep hours per client per month, then divide by stores visited. That gives you cost per store — the clearest unit for comparing merchandising profit margins across accounts.
A rep earning $22/hour who spends 3.5 hours per store visit costs you $77 per location before a single mile of drive time. Multiply that across 40 stores and the math gets uncomfortable fast.
How to Include Travel, Mileage, Rework, and Management Costs
Travel and mileage alone can add 15% to 25% to a client’s true cost — yet most agencies never bill for route inefficiency. Rework — returning to fix a missed or failed execution — is pure margin destruction that rarely appears on any report.
Management time is the other silent drain. Some account managers spend hours chasing field issues for one difficult client. That pulls time away from profitable ones.
Client reporting tools that surface these costs make the problem visible. Studies on labor cost attribution show that untracked management overhead can reach up to 18% of total service delivery cost (Pmc Ncbi Nlm Nih).
📊 By the Numbers
Untracked management overhead can consume up to 18% of total service delivery cost per client.
Once you run these numbers, the real question becomes obvious: which specific clients on your roster are actually worth keeping?
Which Merchandising Clients Are Actually Profitable?
That hidden field labor doesn’t just shrink margins. It reveals which clients are worth keeping.
Most agencies are shocked by what they find. Their biggest revenue accounts often rank last in true merchandising client profitability once field costs get properly assigned.
The fix starts with honest client profitability measurement. That means tracking not just what a client pays, but what they cost to serve at the store level.
Libguides Eku shows that companies tracking customer-level costs find 20–30% of clients generate over 80% of net profit.
Revenue vs Gross Margin by Client
Revenue tells you who spends the most. Gross margin tells you who actually makes you money.
A client paying $200K annually can destroy profit. If their store density, rework rate, and route complexity burn 60% of that in field labor, the math turns ugly fast.
Solid client reporting tools make this visible fast.
High-Volume Clients vs High-Margin Clients
High-volume clients feel safe. They fill your calendar and your invoices.
But high-margin clients fund your growth, your team, and your next hire.
An Investopedia-backed principle applies here: market value comes from profitable volume, not just volume. Chasing headcount without tracking merchandising profit margins per client is a slow bleed.
How Visit Frequency and Store Density Affect Profitability
A client with 400 stores visited weekly costs far more to serve than their contract suggests. Every extra stop, reroute, or missed-store recovery adds untracked labor that standard P&Ls never catch.
This is where customer profitability analysis earns its keep. It maps real field costs to real clients, not just billing codes.
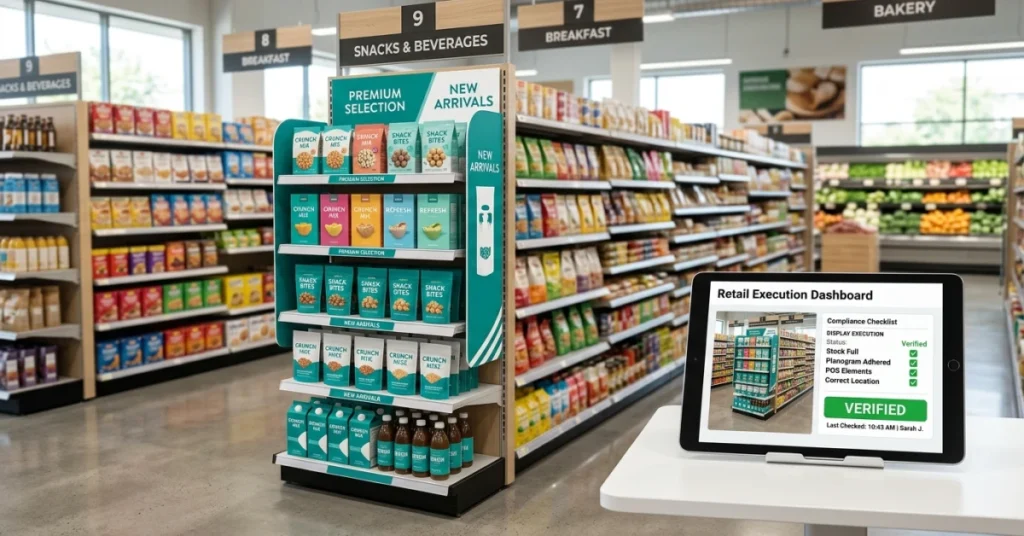
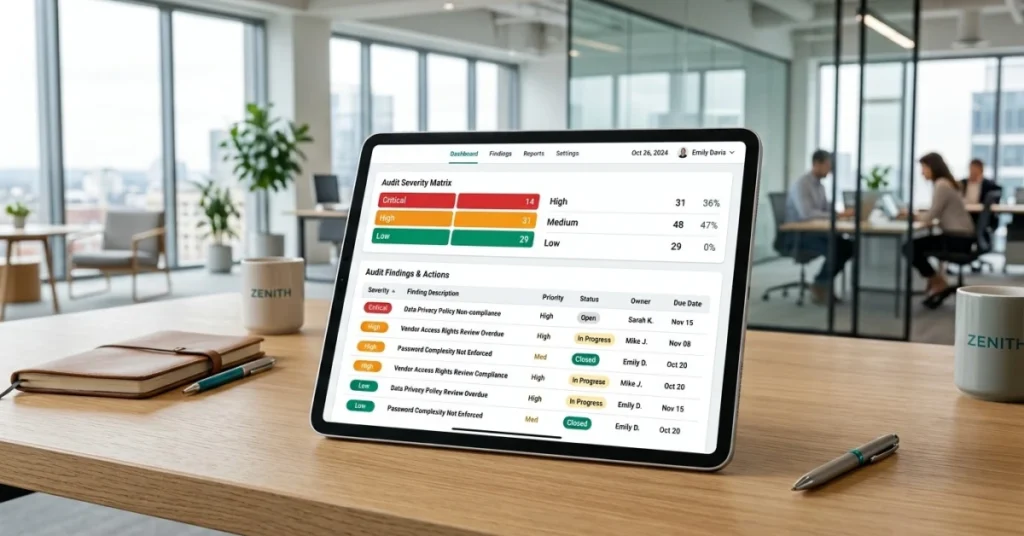
A client profitability dashboard that shows cost-per-visit by account changes every pricing conversation you have.
📊 By the Numbers
20–30% of clients typically generate over 80% of a merchandising agency’s net profit.
Knowing which clients drain you is only half the battle. The real question is what you do about it next.
How Can Merchandising Agencies Improve Client Profitability?
Once you know which clients cost you money, fix the field-execution layer first. Most agencies jump straight to repricing — but the real lever is operational.
Untracked labor hours and route inefficiencies are the silent killers of merchandising profit margins.
A rep spending 40 extra minutes per visit on out-of-scope tasks never shows up on a standard P&L. But that hidden time destroys client profitability measurement over months.
Optimize Territory and Route Planning
Drive time is pure cost with zero billable output. Agencies that cluster visits by geography cut field labor costs by up to 20% without touching a single client contract.
Route optimization tools assign reps to nearby accounts in one sweep. That alone can recover hours of paid time that currently vanish between stops.
Standardize Visit Scope and Task Duration
Scope creep is the fastest way to turn a profitable account into a money-losing one. Set hard time budgets per visit type and enforce them in your field software.
When reps know a shelf audit takes 25 minutes, they stop absorbing extra tasks. Those tasks were never priced into the deal.
Reduce Rework Through Better Execution Controls
Rework is a hidden tax on every client visit. A missed display or wrong planogram placement means a second trip — and that trip is almost never billed.
Photo verification and digital checklists cut rework rates significantly. Less rework means fewer unplanned labor hours eating into your margin.
Automate Reporting and Proof of Execution
Manual reporting steals time from billable field work. Agencies using automated proof-of-execution tools report saving 3–5 hours per rep each week — hours that go straight back to productive visits.
A real-time client profitability dashboard lets managers catch cost overruns before they compound. Learning how to manage multiple clients at scale depends on this visibility.
Renegotiate Pricing for Unprofitable Accounts
Some accounts can’t be fixed operationally — the pricing model is broken from the start. A thorough customer profitability analysis will surface these clients fast.
Repricing talks are easier when you bring field-cost data to the table. Show clients exactly what their account costs to service and pushback drops.
According to Moz, data-backed proposals close at rates up to 35% higher than gut-feel pitches. Hard numbers make the conversation short.
Tracking field costs at the account level — not just the portfolio level — is what separates top performers. Statista research on field service profitability benchmarks backs this up.
The agencies winning on merchandising client profitability aren’t just smarter pricers. They’re tighter operators.
📊 By the Numbers
Agencies that cluster field visits by territory cut unproductive drive time by up to 20%, directly improving net margins.
Every fix in this playbook compounds — but only if you measure the right things. The question isn’t whether you can improve.
It’s whether you’ll still be guessing next quarter — or finally know.
Conclusion
Hidden labor overruns and route inefficiencies don’t fix themselves. They compound quietly until a once-profitable client becomes a margin drain. Merchandising client profitability is a strategic choice, not a lucky outcome. It starts with knowing your real field costs down to the hour.
Most agencies never run a true client profitability audit. Their data lives in disconnected spreadsheets, not a live client profitability dashboard tied to actual field activity.
Teradata found that companies using customer profitability analysis often discover their bottom 20% of clients generate negative margins. Most merchandising agencies never spot this. Field costs stay invisible on standard P&Ls.
Scope creep and untracked labor are the real margin killers — not your pricing sheet. PMC confirms that gaps in operational cost attribution consistently distort profitability signals in service businesses.
FieldPie captures field labor, route data, and job-level costs in real time. Your client profitability measurement reflects what actually happened in the field — not what was budgeted.
Run your first client audit this week. The data will show you exactly which clients to reprice, restructure, or walk away from.