✦ Key Takeaways
Poorly measured promotional displays waste up to 40% of retail marketing budgets every year.
→ ROI calculation reveals which displays drive real revenue lift.
→ Tracking the wrong metrics inflates perceived display performance significantly.
→ Simple formula: incremental sales minus display cost, divided by cost.
In this article:
What Is Promotional Display ROI and Why Does It Matter?
How to Calculate Promotional Display ROI
Which Metrics Should You Track to Measure Display Performance?
Key takeaway: Measure promotional display ROI precisely or keep funding displays that silently drain profit.
What Is Promotional Display ROI and Why Does It Matter?
Most brands spend thousands on in-store displays and walk away with no clear proof they worked. That gap — between money spent and results measured — is exactly what promotional display ROI is designed to close.
ROI stands for return on investment. In plain terms, it answers one question: did this display earn back more than it cost?
Understanding Promotional Display ROI in Retail Campaigns
A display’s return isn’t just the sales it drives — it’s every behavior it changes before a shopper reaches the register. Pauses, glances, and unplanned grabs are the real signals that separate a high-performing display from one that just looks good.
Brands that track these retail display performance metrics consistently outperform those that only count final sales. The sale is the last event — not the only one worth measuring.
Why Brands Struggle to Measure Display Effectiveness
Shoppers rarely buy from one touchpoint alone — they see an ad, pass a display, and then decide. That murky path makes it hard to credit any single display with a sale (Livingstondaily reports that 83% of consumers can recall the brand on a promotional product they received in the past two years).
Without a clear link between display and decision, most teams default to guessing. That guess costs real money every time a weak display gets reordered.
The Difference Between Display Visibility and Real Business Impact
A display can get noticed and still move nothing. Visibility is a starting point — impact is what happens after a shopper stops and engages.
Deadsoxy notes that promotional products generate an average cost per impression of just $0.002 — but low cost means nothing if you can’t connect the impression to a result. The real question isn’t whether shoppers saw your display — it’s whether seeing it changed what they did next.
Before you can answer that, you need a formula that actually fits how retail displays work — and that’s where most standard ROI calculations fall short.
How to Calculate Promotional Display ROI
That gap between spending and proof closes the moment you apply a real formula. Forget a vague sense that the display “seemed to work.”
The math is simple. Subtract your total display costs from the revenue it generated, divide by total costs, then multiply by 100 to get a percentage.
But here’s where most newcomers get tripped up. Standard ROI formulas assume clean attribution — one cause, one sale — and promotional displays rarely work that way.
Understanding the Promotional Display ROI Formula
The core formula is: (Revenue from Display − Display Costs) ÷ Display Costs × 100. A display that cost $500 and drove $1,200 in sales returns a 140% ROI — on paper.
The problem is “revenue from display” is rarely a clean number. A shopper may see the display, leave, and buy online later.
Or they grab a product because a friend mentioned it. The display confirmed the choice — but who gets the credit?
Which Costs Should Be Included in ROI Calculations?
Most people count materials and forget everything else. Your true cost includes design, printing, shipping, installation labor, and the floor space the display occupies — which carries a real opportunity cost.
Skipping these hidden costs inflates your display ROI figures and leads to bad budget decisions down the line. Every dollar you miss on the cost side makes a weak display look like a winner.
How to Measure Incremental Sales Generated by Displays
Incremental sales are the purchases that happen because of the display — not ones that would have occurred anyway. The cleanest way to isolate them is to compare sales in stores with the display against matched stores without one, over the same time window.
Retail display performance metrics like sales lift percentage cut through the noise fast. Paid advertising research shows that campaigns tracked with proper attribution generate up to 30% higher measured returns than those using last-click models alone, per Researchgate.
That same principle applies directly to in-store displays. Better attribution means more honest numbers — and smarter spending.
Promotional effectiveness measurement doesn’t stop at the register. Driveresearch confirms that behavioral signals — pauses, product touches, unplanned grabs — predict purchase intent well before a sale is recorded.
A display that changes behavior is already earning its keep. That’s true even when the register hasn’t rung yet.
📊 By the Numbers
Proper attribution tracking can reveal up to 30% more measurable return from the same display spend.
The formula gives you a starting point. The metrics you feed into it decide whether your answer is honest or just optimistic.
Which signals actually tell you a display is working before the sale ever happens?
Which Metrics Should You Track to Measure Display Performance?
Attribution is messy — so the fix is tracking signals that appear before the sale, not just after it.
Behavior change is the real proof that a display is working. Three metric categories reveal it clearly.
Most retailers look only at final sales numbers. That misses the leading signals that predict whether a display will convert over time.
dealer performance tracking shows that pre-sale signals beat post-sale data as early warning tools. They catch problems before revenue takes a hit.
Sales Metrics That Show Promotional Impact
Sales lift — the percentage increase in units sold during a display period versus a baseline — is the most direct measure of promotional display ROI.
Compare promoted SKU velocity against a control store or pre-display period. That isolates the display’s actual contribution.
Also track attachment rate: how often shoppers buy a related item alongside the promoted product.
A display driving a 15% or higher attachment rate is changing purchase behavior. It’s not just capturing existing intent.
Display Execution Metrics That Affect ROI
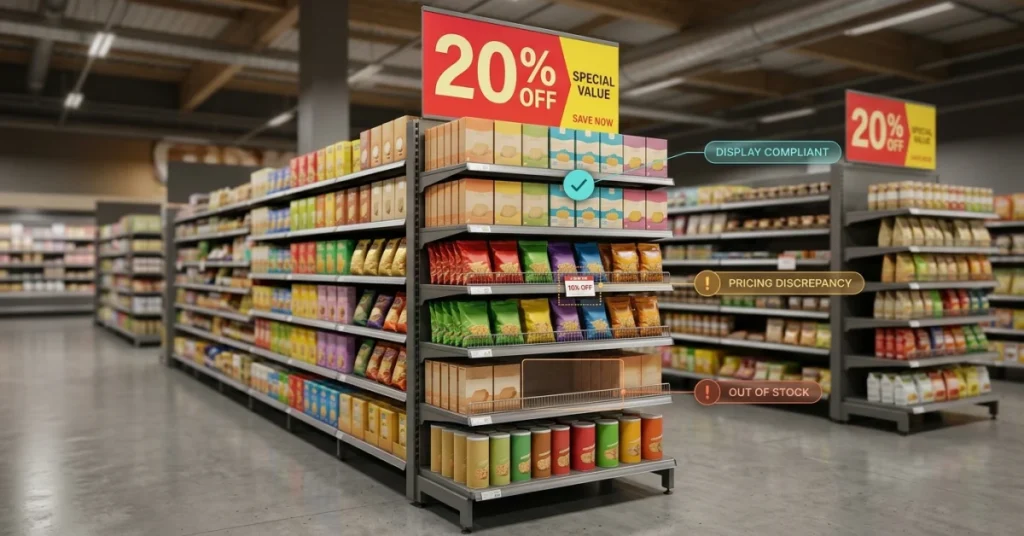
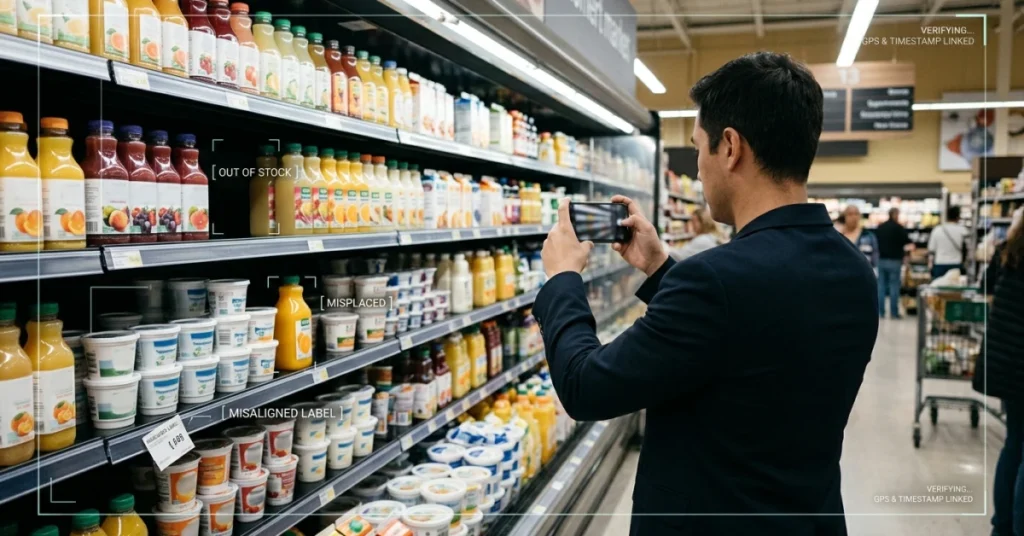
A display that isn’t stocked, placed correctly, or maintained kills ROI before a single shopper arrives.
Compliance rate — the share of locations where the display is set up exactly as planned — directly shapes your POS display return on investment.
Over 70% of purchase decisions happen at the point of sale (Facilisgroup). A display that’s out of stock or misplaced loses that opportunity entirely.
Track fill rate and placement accuracy weekly, not monthly.
Shopper Engagement Metrics to Monitor
Dwell time measures how long a shopper pauses near a display. Engagement rate measures the share of passersby who stop and interact.
Both are clear pre-sale signals. They measure behavior change directly — which is why promotional effectiveness measurement must go beyond revenue alone.
Brands that track engagement data see a real edge. Sender reports that companies using behavioral data to guide marketing decisions improve campaign ROI by up to 20%.
A display that earns long pauses and unplanned grabs is performing. That’s true even before the register confirms it.
📊 By the Numbers
Brands using behavioral engagement data improve display campaign ROI by up to 20% over sales-only tracking methods.
Top-performing displays aren’t always the flashiest ones. They’re the ones backed by metrics that catch problems early.
Strong metrics prove value fast. They don’t wait for the final sales report to land.
Conclusion
Dwell time, engagement rate, and unplanned lift are your earliest proof a display is working. These signals are more honest than any end-of-week sales report.
Retailers who track these leading indicators catch underperforming displays weeks before sales data ever flags a problem.
Most teams still measure retail display performance metrics only at the register. That means they’re always reacting too late. Promotional display ROI isn’t just a final sales number. It’s the full chain of behavior that leads to the sale.
Most merchandising teams can’t tell which display drove results and which just looked good. Without real-time field data, that gap costs revenue.
FieldPie captures photo-based compliance checks and customizable audit forms. It also pulls live performance data from every display location so your team spots execution gaps fast.
Start tracking what actually moves buyers. Explore FieldPie’s field execution and merchandising tools. Turn display data into decisions that pay off.