


✦ Key Takeaways
Poor quality costs manufacturers up to 20% of annual revenue—most of it preventable with proper inspection.
- → Defects caught early cost 10x less to fix downstream.
- → Inspections cover dimensions, materials, function, and visual standards.
- → Tracking defect rate and yield KPIs drives continuous improvement.
In this article:
- What Is Quality Inspection in Manufacturing?
- Why Quality Inspection Matters in Manufacturing
- What Is Checked During a Manufacturing Quality Inspection?
- What KPIs Should Manufacturers Track?
Key takeaway: Systematic quality inspection is the single factor separating profitable manufacturers from struggling ones.
What Is Quality Inspection in Manufacturing?
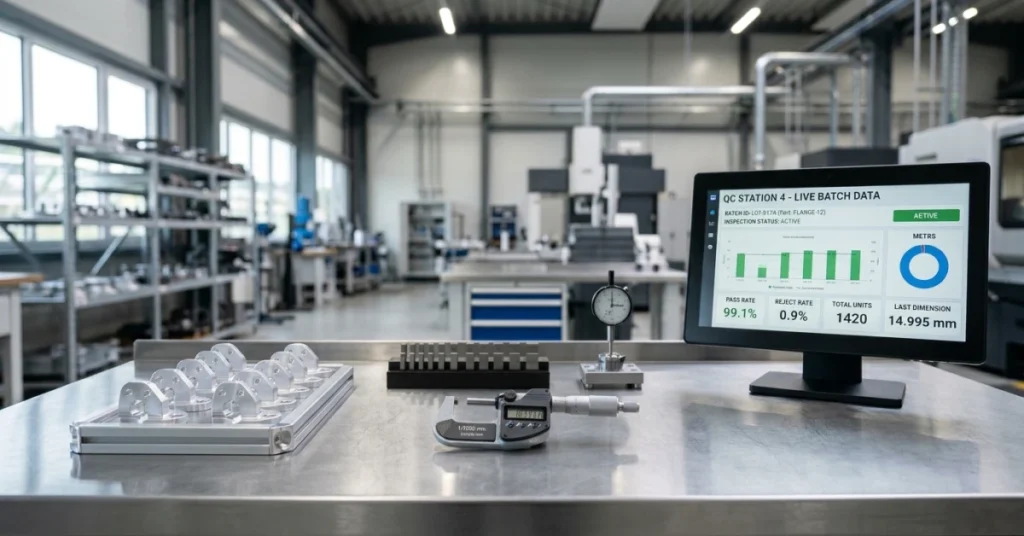
Poor product quality costs manufacturers an estimated $8,000 per minute of unplanned downtime — yet most facilities still treat inspection as a final checkpoint rather than a continuous intelligence system.
A quality inspection in manufacturing is a structured process of measuring, testing, and evaluating products or materials against defined specifications. But its real function is data collection — every defect caught, every measurement logged, feeds a feedback loop that makes the next run smarter.
Definition and Core Objectives
Manufacturing quality inspection is the systematic verification that materials, components, and finished goods meet predetermined standards. Its core objectives are defect detection in manufacturing, process consistency, and — critically — generating actionable data that prevents recurrence.
Inspection only creates value when it feeds a feedback loop. A check that catches a defect but never informs the upstream process is overhead, not intelligence.
Types of Manufacturing Quality Inspections
The manufacturing quality inspection process spans four primary stages: pre-production, in-process (IPQC), pre-shipment, and container loading inspection. Each stage targets different failure modes — skipping any one creates a blind spot that compounds downstream.
According to 6sigma, companies that implement structured in-process inspections reduce defect escape rates by up to 30% compared to end-of-line-only inspection models.
Quality Inspection vs Quality Control
Quality inspection is a specific activity — a physical check at a defined point. Quality control in manufacturing is the broader system of policies, procedures, and measurements that governs whether inspection data actually changes anything.
Iiot World notes that manufacturers using data-driven quality programs — not just inspection checklists — consistently outperform peers on first-pass yield. This distinction matters: inspection without a control system is just documentation of failure, not prevention of it.
That range isn’t a rounding error — it’s the difference between a profitable operation and one bleeding out quietly. Manufacturers who treat quality control as a compliance formality consistently absorb those losses without understanding their source. Every uninspected defect that escapes to the customer carries a hidden multiplier: warranty claims, brand damage, and regulatory exposure compound the original production failure. A structured review process only earns its cost when it feeds decisions — not just reports. As Sciencedirect confirms, integrating structured inspection data into production workflows measurably reduces recurrence rates across subsequent runs. Understanding food quality control systems illustrates how even high-volume, perishable-goods manufacturers operationalize this feedback discipline at scale.
How Defects Impact Production Costs and Customer Satisfaction
A single escaped defect doesn’t end at the customer complaint — it triggers a cost cascade that dwarfs the original investment in oversight. Rework, expedited replacements, and churn from dissatisfied buyers all trace back to defect detection that happened too late or not at all.
Customer trust erodes faster than it builds. One product failure can undo years of delivery consistency, especially in industries where safety and precision are non-negotiable.
The Role of Quality Inspection in Operational Efficiency
Systematic evaluation on the production floor isn’t overhead — it’s the earliest warning system a line has. Catching variance at the source costs a fraction of what downstream correction demands.
The verification checkpoints a facility deploys — incoming, in-process, or final — determine how much bad data accumulates before anyone acts on it. Earlier intervention means shorter feedback loops and smarter adjustments on the next run.
📊 By the Numbers
Poor quality costs manufacturers up to 30% of gross sales — most of it invisible until inspection data surfaces the pattern.
The real question isn’t whether to inspect — it’s knowing exactly which materials, dimensions, and process stages demand scrutiny before a defect has any room to travel.
What Is Checked During a Manufacturing Quality Inspection?
Those silent losses compound because manufacturers inspect reactively — catching defects after they’ve already consumed materials, labor, and time. A structured quality management system turns every inspection point into a data feed, not just a pass/fail gate.
The manufacturing quality inspection process spans four distinct stages — and skipping any one of them is where compounding losses begin. Each stage catches a different failure mode, and together they form a feedback loop that makes the next run measurably better.
Raw Material and Incoming Goods Inspection
Defects introduced at intake cost 10x more to fix downstream than at the source — making incoming inspection the highest-leverage checkpoint in the entire process. Inspectors verify dimensions, material certifications, supplier conformance records, and visual integrity before anything enters the production floor.
AI-driven vision systems now catch incoming defects that manual inspection misses at scale (according to Automate, automated visual inspection reduces defect escape rates by up to 90%). That number reframes incoming inspection from a cost center into a risk elimination engine.
In-Process Production Inspections
In-process checks — first article inspection, in-line sampling, and process parameter monitoring — catch drift before it becomes a batch failure. This is where defect detection in manufacturing shifts from reactive to predictive.
Inspectors document tolerance deviations, machine calibration status, and operator adherence to work instructions at defined production intervals. Every recorded deviation is a data point that reveals whether a process is drifting or stable.
Final Product Quality Checks
Final inspection validates that the finished unit meets every specification — dimensional, functional, cosmetic, and regulatory — before it leaves the facility. This is the most visible checkpoint, but it should never be the only one.
Manufacturers who rely solely on final inspection are already too late — defects found here represent waste that earlier checkpoints should have prevented. Leadsinfra notes that AI-integrated quality control in manufacturing reduces final-stage rejection rates significantly by shifting detection upstream.
Packaging and Shipment Verification
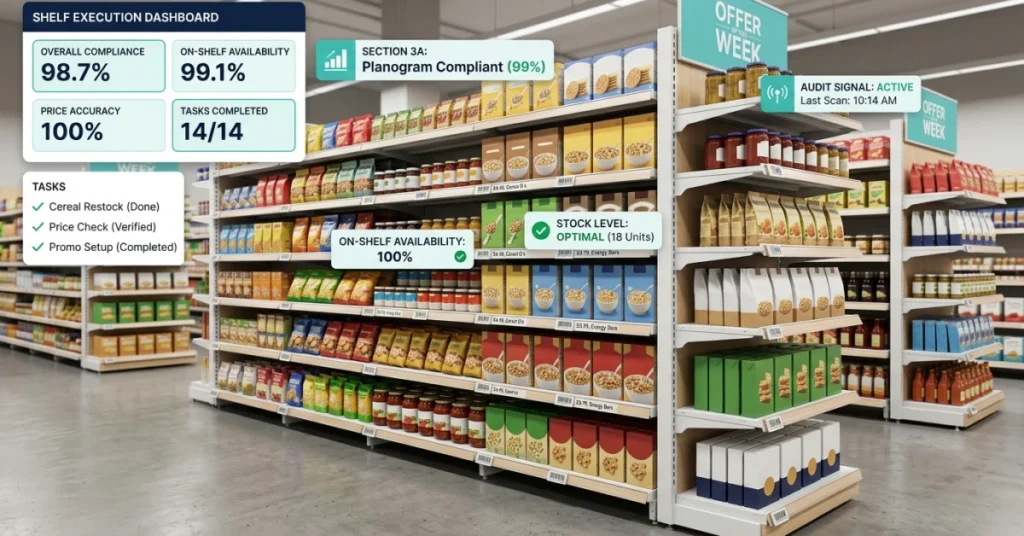
Packaging inspection confirms labeling accuracy, unit counts, protective packaging integrity, and compliance with customer or regulatory shipping requirements. A perfect product in a damaged or mislabeled package still generates a customer complaint and a return.
Shipment verification closes the loop — it’s the final confirmation that what was ordered, built, and inspected is exactly what leaves the dock. Every discrepancy logged here feeds directly back into the types of quality inspections that need tightening upstream.
📊 By the Numbers
Automated visual inspection systems reduce defect escape rates by up to 90%, per Automate industry data.
Knowing what to inspect is only half the equation — the real leverage comes from knowing which numbers to track so that inspection data drives decisions, not just documentation.

What KPIs Should Manufacturers Track?
Actionable inspection data only creates value when you measure the right outputs — and most manufacturers don’t. Tracking the wrong metrics turns your manufacturing quality inspection process into a reporting exercise instead of an improvement engine.
Defect detection in manufacturing means nothing if the numbers never feed back into process decisions. The KPIs below are the ones that close that loop — converting raw inspection data into production intelligence.
Defect Rate and Scrap Rate
Defect rate measures the percentage of nonconforming units produced per run. Scrap rate isolates units that cannot be reworked — the most expensive form of quality failure.
Manufacturers with high scrap rates often discover the root cause sits two or three stages upstream from where defects surface. Tracking both metrics together reveals that pattern fast.
First Pass Yield (FPY)
First Pass Yield measures the percentage of units that complete production without any rework, repair, or rejection. World-class manufacturers consistently target FPY above 95% — anything below signals a systemic process problem, not a random one.
FPY is the single most honest indicator of whether your quality control in manufacturing is working or just catching failures after they’ve already cost you money.
Rework and Return Rates
Rework rate tracks units that required correction before shipping — a hidden cost most manufacturers dramatically underestimate. 6sigma data consistently shows poor quality costs manufacturers between 5% and 30% of annual revenue, with rework as a primary driver.
Customer return rates close the feedback loop by confirming whether in-house inspections are catching what actually matters to the end user. A rising return rate with a stable internal defect rate means your types of quality inspections are measuring the wrong things.
Inspection Completion and Compliance Scores
Inspection completion rate measures how consistently your team executes scheduled checks — because skipped inspections create invisible data gaps. Compliance scores track whether inspectors follow standardized procedures, which directly affects data reliability.
Incomplete inspection records are as dangerous as failed inspections — they make trend analysis impossible and leave you managing quality by instinct rather than evidence.
📊 By the Numbers
Manufacturers targeting First Pass Yield above 95% reduce total quality costs by up to 30% annually.
The real question isn’t which KPIs to track — it’s whether your inspection system is structured to make those numbers mean something beyond the last production run.
Conclusion
Closing the loop between defect detection and process correction is where quality inspection in manufacturing finally earns its value — not at the checkpoint, but in what happens after. Manufacturers who treat every inspection as a data input reduce repeat defects by up to 30% within the first year of structured feedback cycles.
The manufacturing quality inspection process only compounds value when each check feeds the next production decision — not when it simply flags a bad unit. Ebsco confirms that statistical quality control methods tied to real-time data loops consistently outperform reactive inspection models across defect detection in manufacturing.


