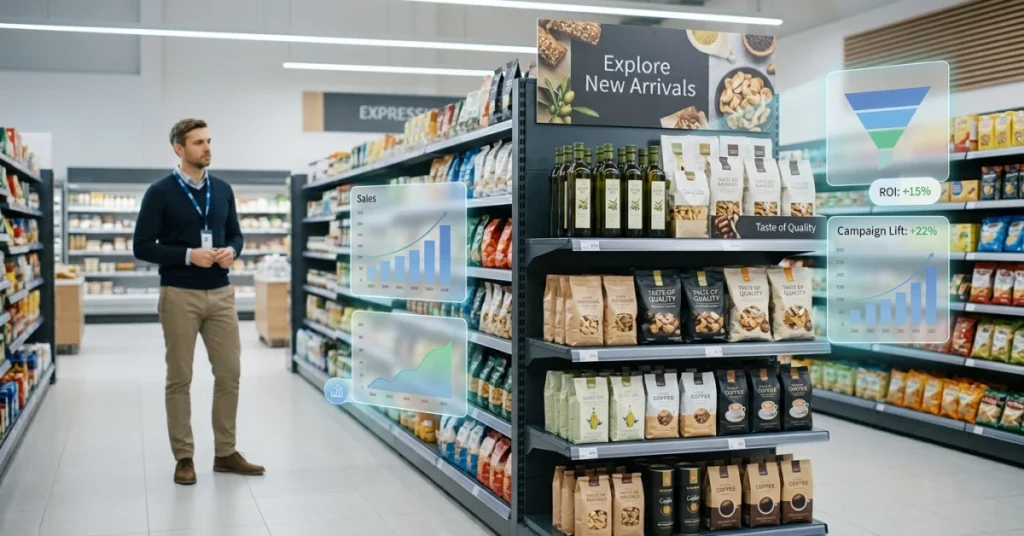
✦ Key Takeaways
Effective promotional displays can lift in-store sales by up to 20%, yet most brands never measure whether their investment pays off.
→ Poor ROI tracking wastes millions in annual display budgets.
→ Key metrics like lift rate and cost-per-conversion reveal true performance.
→ Small display adjustments can double conversion rates overnight.
In this article:
What Is Promotional Display ROI?
How To Calculate Promotional Display ROI
Key Metrics For Display ROI
How To Measure Display Performance In Stores
Factors That Affect Display ROI
How To Improve Promotional Display ROI
Key takeaway: Measure your promotional display ROI or keep funding guesswork with real money.
What Is Promotional Display ROI?
Most retailers put up a display, watch sales for two weeks, and call it a win if numbers go up. But that gut-check method can’t tell you whether the display drove those sales — or whether they would have climbed anyway.
Promotional display ROI measures the actual return a brand earns from a physical in-store display, relative to what that display cost to produce and run. The real challenge is isolating the display’s contribution from normal sales noise — and most retailers never solve that problem.
Understanding Display ROI And Business Impact
Point of sale display ROI answers one question: did this display earn more than it cost? Promotional products generate an average $4.40 in revenue for every $1 spent, per Deadsoxy. Yet most brands can’t prove their specific display came close to that return.
The reason is “baseline blindness” — launching a display without first recording what normal sales look like. Without that pre-display baseline, you can’t separate the display’s impact from a seasonal spike or a competitor going out of stock.
Why Display ROI Matters For Brands And Retailers
Retailers who measure POP display ROI consistently beat those who rely on instinct. Data shows which displays to scale and which to cut. Understanding in-store display compliance is a key part of that process.
A display that looks great but sits in the wrong aisle quietly destroys margin. Knowing your promotion ROI forces those problems into the open before they repeat.
Display Visibility Vs. Sales Impact
Visibility and sales impact are not the same thing. Mvpvisuals reports that high-traffic display placement can lift shopper engagement by up to 30% — but engagement alone doesn’t pay for the display.
A shopper who stops, looks, and walks away is a visibility win and a sales failure. Measuring retail display ROI means tracking what happens after the glance — the pick-up, the conversion, the receipt.
To measure any of that, you need a formula that captures the display’s true contribution. That’s exactly where most brands get the math wrong.
How To Calculate Promotional Display ROI
That isolation problem has a direct fix. Define “success” before the display goes up. The formula forces you to do that.
Most retailers skip that step entirely. They eyeball a sales bump and feel good. Then they move on. They never know if the display drove the lift — or if a holiday weekend did.
The Promotional Display ROI Formula
The core formula is simple: ROI = (Incremental Revenue − Display Costs) ÷ Display Costs × 100. Every number in that formula demands a pre-display baseline. Without one, “incremental revenue” is just a guess.
Retailers who track in-store display compliance consistently report cleaner data. They know exactly when and where each display was active.
Key Costs And Revenue Factors
Display costs include design, production, shipping, and setup labor. Most brands undercount by at least 20% by forgetting freight and field labor.
Revenue factors include units sold at the display, average transaction value, and margin per unit — not gross sales alone. Point of sale display ROI drops fast when you measure revenue but ignore margin.
A display that moves 500 low-margin units can still lose money.
Measuring Incremental Sales From Displays
Incremental sales are the units sold above your baseline — what you would have sold with no display at all. Retailers who skip this step measure total sales, not display performance. Those are two very different numbers.
Promotion ROI only becomes reliable when you compare display-period sales against a matched control period or a comparable store. Researchgate finds that campaigns measured against a defined baseline show up to 35% more accurate ROI attribution. Campaigns measured in isolation fall well short of that mark.
Firework reports that brands using structured measurement frameworks see marketing ROI improve by an average of 28% within one year.
📊 By the Numbers
Brands with structured ROI frameworks improve marketing returns by an average of 28% within one year.
Now you know how to run the formula. The next step is feeding the right numbers into it. That is exactly what the key metrics below will tell you.
Key Metrics For Display ROI
Baseline First, Always Displays that skip a pre-launch baseline miss the one number that makes every other metric meaningful.
Compliance Kills ROI Quietly Studies show up to 50% of displays are never set up correctly, draining promotional display ROI before a single sale.
Cost Per Sale Is The Real Score Divide total display spend by incremental units sold. That one number cuts through all the noise.
Stock-Outs Erase Lift Fast A display that runs out of product mid-promotion can wipe out days of hard-won sales lift in hours.
That baseline is not just a starting point — it is the lens that makes every metric below readable.
Without it, you are comparing noise to noise.
Sales Lift And Revenue Growth
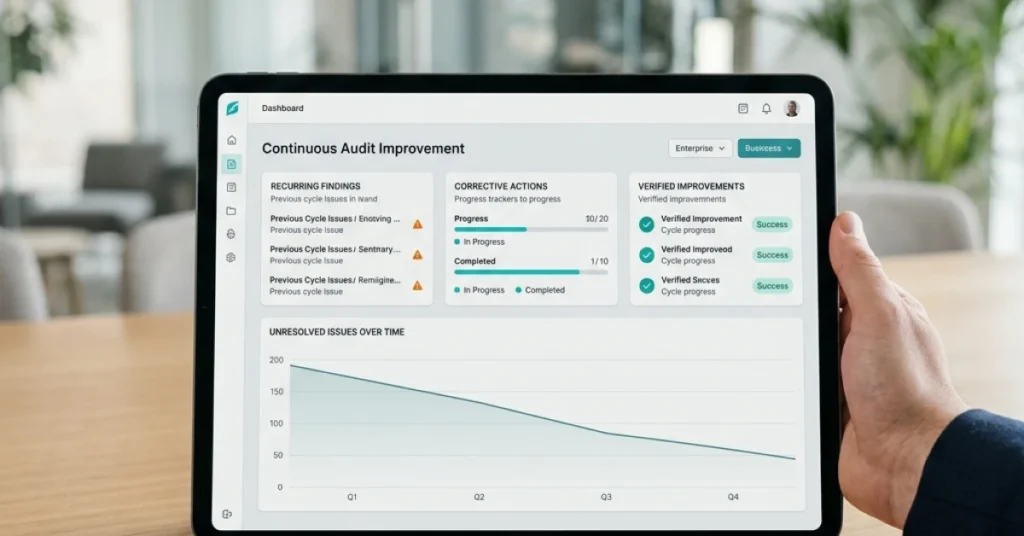
Sales lift is the gap between what you sold during the display period and what your baseline predicted. That gap — and only that gap — is the display’s true contribution to revenue growth.
Promotional products drive real behavior. Over 83% of consumers say they are more likely to do business with a brand after getting a promotional item (Facilisgroup).
That kind of pull only shows up in your numbers when you have a clean baseline to measure against.
Display Compliance And Execution Quality
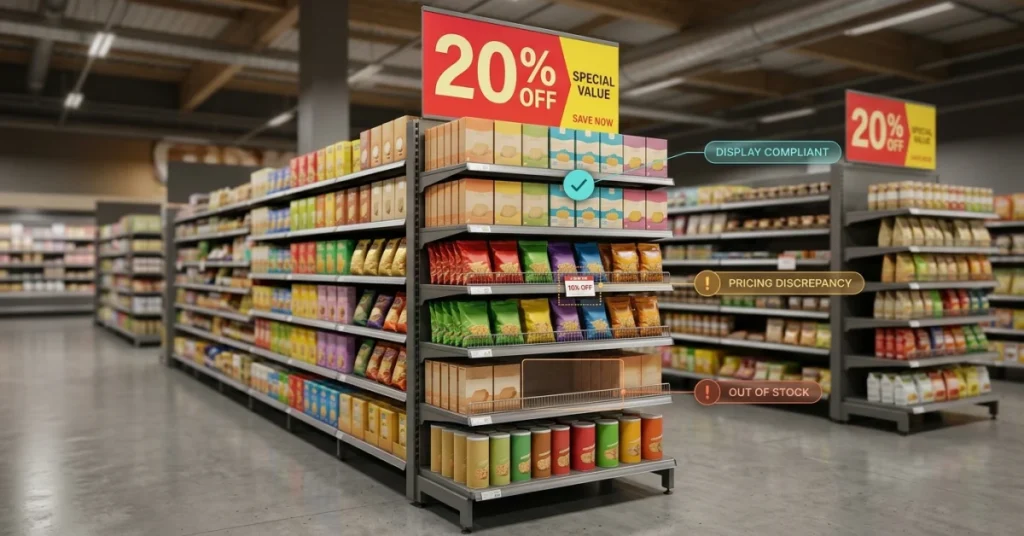
A display that never gets built — or gets built wrong — produces zero lift. Compliance means the display went up on time, in the right location, with the right product, exactly as planned.
Poor execution is one of the most common reasons point of sale display ROI disappoints retailers. Learning the basics of retail display compliance can close that gap before it costs you.
Stock Availability And Product Performance
A display with empty shelves is worse than no display at all — it draws attention to a product you cannot sell. Track stock levels daily during any active promotion, not weekly.
Not every product earns its spot on a display. Measure sell-through rate — units sold divided by units stocked — to see which items actually pull their weight.
Cost Per Incremental Sale
This is your promotion ROI calculation in one clean number: total display cost divided by incremental units sold above baseline. Lower is better. Always.
Businesses that track ROI consistently are 1.6 times more likely to hit their revenue goals (Sender). Cost per incremental sale turns measuring retail display ROI from a vague goal into a repeatable discipline.
Knowing which metrics matter is only half the battle. The harder question is how you capture that data inside a live store.
How To Measure Display Performance In Stores
Once you fix the baseline blindness problem, the real work begins. You need to collect the right numbers from the right places. Most retailers track total store sales and call it a day.
That tells you almost nothing about promotional display ROI on its own. You need display-level data, not store-level noise.
Isolate exactly what the display sold. Then track what it cost and what sales looked like before it went up.
Comparing Display And Non-Display Locations
The fastest way to measure display impact is a simple A/B split. Put the display in half your stores and leave the other half alone.
Stores without displays become your control group. They show you what normal sales look like without the display’s influence.
Retailers who use this method consistently find 15–30% higher unit velocity in display locations versus non-display locations (Deadsoxy). Without that side-by-side comparison, you are just guessing which sales the display actually drove.
Using Store-Level Sales Data
Pull weekly sales data at the SKU level — not the category level — for every store running the display. Category-level data hides the display’s real contribution behind unrelated product movement.
A solid retail display compliance guide will tell you to pair sales data with compliance photos. A display that was never properly set up cannot produce reliable ROI numbers.
Bad execution data poisons good sales data every time.
Measuring Short-Term And Long-Term Impact
Most teams only measure the first two weeks of a display run and stop there. That misses the tail.
Some displays build shopper habit over four to six weeks. They quietly lift repeat purchases long after the initial spike fades.
Track your point of sale display ROI in two windows. Measure the first two weeks for immediate lift. Then measure weeks three through six for sustained pull. According to Moz, campaigns that track performance across multiple time windows reveal up to 40% more attributable value. Single-window snapshots miss that gain entirely.
📊 By the Numbers
Display locations show 15–30% higher unit velocity than non-display locations in the same store network.
Collecting data is only half the job. The other half is knowing which variables actually move your promotion ROI calculation up or down.
Factors That Affect Display ROI
Location Drives Lift More Than Design End-cap displays outperform mid-aisle placements by up to 30% in incremental unit sales.
Timing Gaps Kill ROI Fast Running a display one week past peak season hurts. It can erase 20% of total revenue contribution.
Poor Execution Wastes Good Creative Displays built incorrectly in the field convert at roughly half the rate. Proper execution makes all the difference.
Baseline Data Is Non-Negotiable Without a pre-display sales baseline, you cannot isolate the display’s true lift from normal store variation.
Once you know what data to isolate, ask: which variables actually move that number? Not every factor carries equal weight.
Confusing a minor variable for a major one is how brands waste display budgets for years. Most never realize it.
Display Location And Shopper Visibility
Where you place a display matters more than almost any other single decision. A product at eye level on an end-cap gets seen by far more shoppers. The same product buried mid-aisle gets ignored.
Promotional display ROI climbs sharply when placement puts the product in the natural path of foot traffic. High-dwell zones — like checkout lanes and store entrances — consistently outperform generic floor space.
Display Design And Product Placement
A cluttered display confuses shoppers and slows decisions. Clean layouts with one clear hero product convert better. Displays that try to feature eight items at once fall flat.
Products placed at eye level and easy to grab drive stronger recall. According to Livingstondaily, 83% of consumers can recall the advertiser on a promotional product they received. That recall window stretches back two years.
The same principle applies in-store. Visibility plus ease of access drives conversion.
Promotion Timing And Store Conditions
A display launched too early or pulled too late bleeds margin without adding lift. Time your display to peak demand windows — not just campaign calendar dates.
That timing discipline separates strong point of sale display ROI from wasted spend. Store conditions matter just as much.
A display in a poorly lit corner or a cluttered aisle loses its impact fast. That holds true no matter how strong the creative is.
Field Execution Quality
The gap between a display as designed and a display as built is where ROI quietly disappears. Shelves stocked wrong, signage missing, or units in the wrong spot all cut into measurable return.
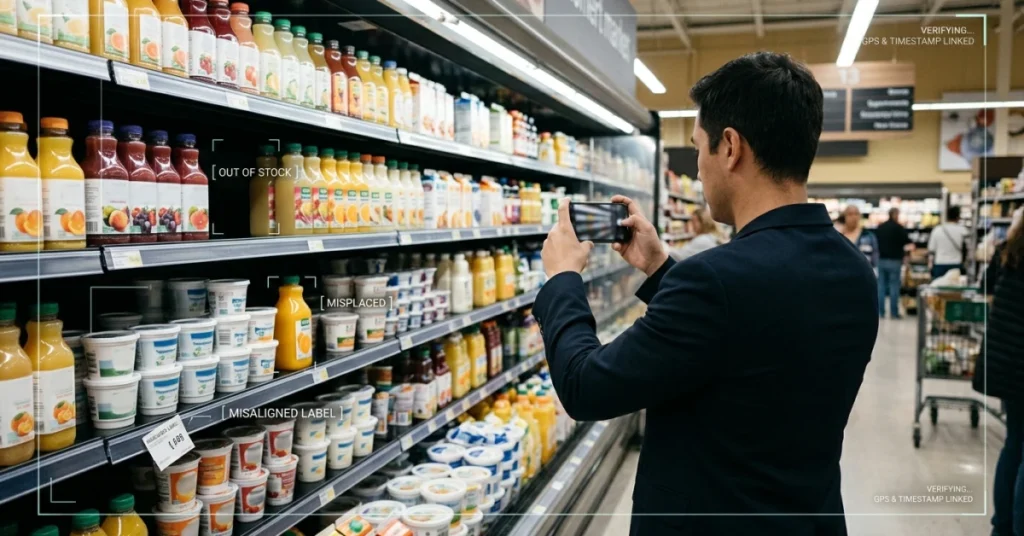
Most brands never catch it. Tracking display compliance in retail with photo-based verification closes that gap directly.
FieldPie captures real-time field photos and flags execution gaps before they drain your promotion ROI calculation.
Research on Researchgate confirms what retail teams already know. Execution quality is the variable most directly tied to whether a campaign returns profit or just generates activity.
The same truth holds for in-store displays. A perfectly designed POP display return on investment depends entirely on whether the display was actually built right.
Knowing which factors hurt your numbers is only half the job. The other half is having a repeatable system to fix them before the next display goes up.
How To Improve Promotional Display ROI
Those four factors — location, timing, execution, and baseline measurement — are not separate problems. Fix them together, and your promotional display ROI stops being a guess and starts being a number you can defend.
Start with execution standards. A display that looks different in every store tells you nothing useful when you try to compare results.
Creating Display Execution Standards
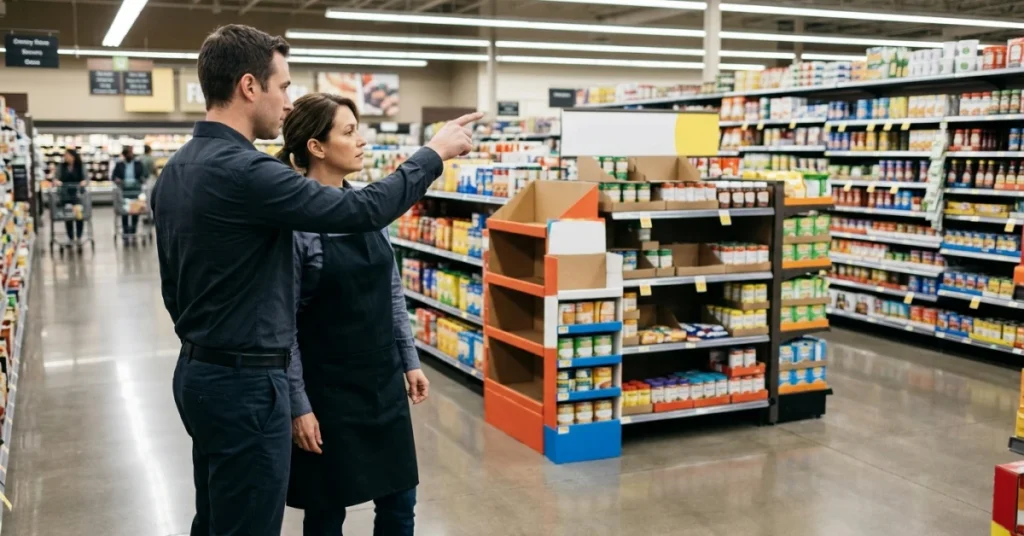
Write down exactly how each display should look — height, product count, placement zone, and signage position. Without a written standard, every store becomes its own experiment.
You can never isolate what actually drove a sales lift. More stores run the display correctly from day one when specs are set before launch.
Tracking Compliance With Field Data
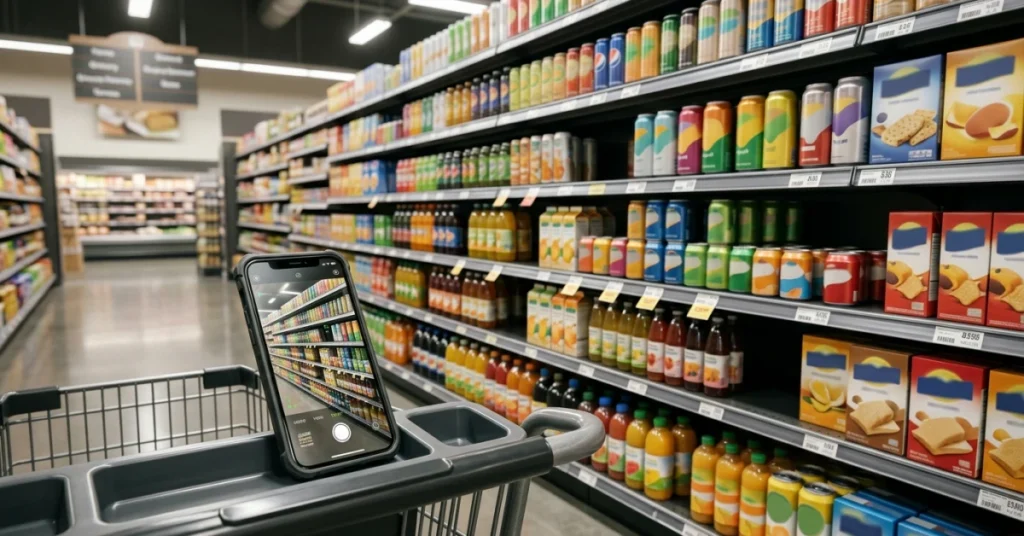
A standard only works if someone checks it. Field teams need a fast, consistent way to log what they see — photos, checklists, and timestamps.
That data makes compliance gaps visible right away. Without it, problems only surface in end-of-quarter regret.
Tools built for retail display compliance let managers spot non-compliant stores within hours, not weeks. FieldPie captures photo-based field data in real time, so your team sees exactly which locations are off-standard before the promotion window closes.
Fixing Issues Before They Impact Sales
Speed matters more than perfection here. A display that goes up wrong on Monday and gets fixed Thursday has already lost three days of selling time.
According to Driveresearch, businesses that act on field data within 24 hours recover far more revenue per promotion cycle than those that review data weekly. Fast feedback loops are not a luxury — they are what turns a compliance standard into real point of sale display ROI.
Scaling Successful Displays Across Stores
Once you find a display setup that beats your baseline by a clear margin, copy it exactly. Facilisgroup reports that promotional displays average a cost-per-impression of just $0.004.
That makes wide rollout of a proven format one of the highest-return moves in retail marketing. Few other tactics come close at that cost.
Scaling only works when you have a documented standard and field data to confirm it landed right. Without both, you are copying a display — not copying the result.
📊 By the Numbers
Promotional displays deliver an average cost-per-impression of just $0.004 — lower than most digital ad formats.
The real shift is not finding a better display. It is building the habit of measuring every display the same way, every time.
That habit is what the data needs to tell you what to scale and what to cut.
Conclusion
Written execution standards are the foundation. They only pay off when you measure before the display goes up — not after.
Baseline blindness is the real reason most retailers can’t prove their display compliance results actually moved the needle.
Retailers who track display-level conversion data — not just store-wide sales — consistently isolate the display’s true contribution. That discipline separates real lift from normal sales variation.
According to Pfiinstore, over 70% of purchase decisions happen at the shelf. That means point of sale display ROI is won or lost in the 10 feet around your display. The register is too late.
Most retailers treat promotional display ROI as a budget problem. It is a measurement habit problem — and the fix costs nothing but discipline.
Moz consistently shows that teams who document baselines and track incremental lift beat those who rely on gut feel. That holds true across every performance channel.
FieldPie captures photo-based field data and real-time execution reports. Use them to tie display compliance to actual sales lift — then start your first baseline audit today.